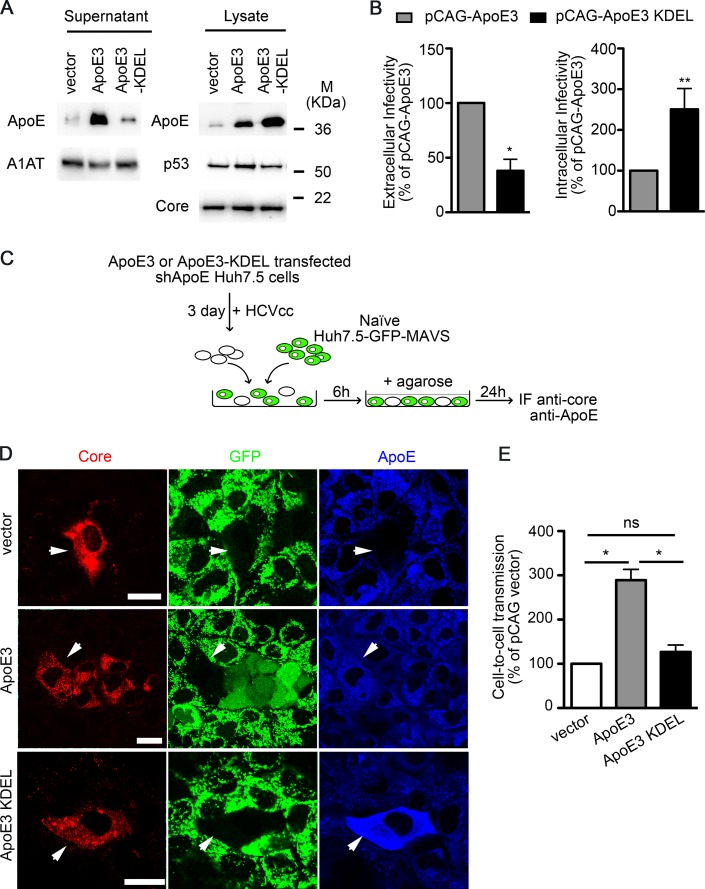
FIG 6.
ApoE retention in the endoplasmic reticulum of donor cells impairs HCV cell-to-cell spread. (A) ApoE-depleted cells were transfected with either pCAG (vector), pCAG-ApoE3 (ApoE3), or pCAG-ApoE3-KDEL (ApoE3-KDEL). Four hours after transfection, cells were inoculated with HCVcc. Cell lysates and supernatants were analyzed 48 h p.i. for the expression of ApoE and its mutant variant by Western blotting. The expression of p53, α1-antitrypsin (A1AT), and HCV core was also examined. M, molecular mass. (B) Extra- and intracellular infectivities of ApoE3- and ApoE3-KDEL-transfected cells after HCVcc infection. Results are presented relative to ApoE3-transfected cells and expressed as the mean value + SD from at least two experiments performed in triplicate. Significance was determined by Mann-Whitney test. (C) Schematic representation of the coculture assay. ApoE-depleted Huh7.5 cells were transfected with pCAG, pCAG-ApoE3, or pCAG-ApoE3-KDEL and infected with HCVcc. These cells were used as donor cells and naive Huh7.5-GFP-MAVS cells as acceptor cells. (D) Immunofluorescence and confocal analysis of HCV cell-to-cell transmission assays (HCV core, red; GFP, green; ApoE, blue). Cell-free infection was blocked by agarose overlay. The top and bottom panels show two examples of no HCV cell-to-cell transmission when using control and ApoE3-KDEL-expressing cells as donor cells, as shown by the absence of both HCV core staining and cytoplasmic GFP fluorescence in acceptor cells next to HCV core-positive, GFP-negative donor cells. The medium panel shows an example of HCV cell-to-cell transmission when ApoE3-expressing cells are used as donor cells, observed by the presence of HCV core staining and cytoplasmic diffuse GFP in acceptor cells next to donor cells. Bars, 50 μm. (E) Cell-to-cell transmission was quantified by counting the number of foci that contained cells with cytoplasmic GFP signal (infected acceptor cells) relative to the total number of core-positive (red) foci and is presented as the percentage relative to pCAG-transfected cells. Results show the mean + SD from two independent experiments performed in duplicate.

