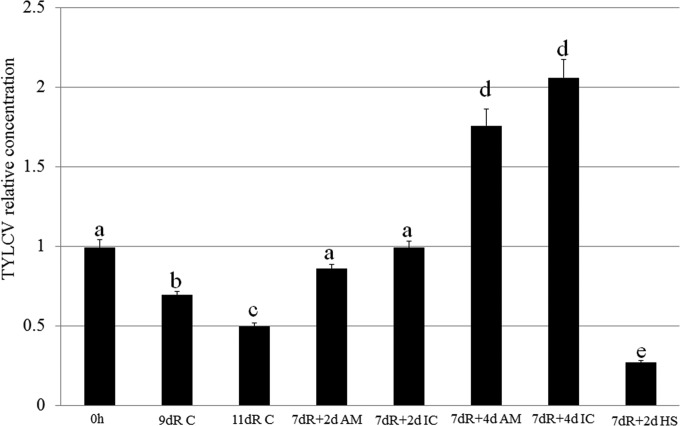
FIG 6.
TYLCV dynamics measured by using the C3 gene sequence under different experimental conditions using qPCR on viral DNA. 0h, TYLCV levels measured immediately after an 8-h AAP; 9dR C, AAP for 8 h and retention on cotton leaves for 9 days; 11dR C, AAP for 8 h and retention on cotton leaves for 11 days; 7dR + 2d AM, AAP for 8 h, retention on cotton leaves for 7 days, and then retention on leaves treated with acetamiprid for an additional 2 days; 7dR + 2d IC, AAP for 8 h, retention on cotton leaves for 7 days, and then retention on leaves treated with imidacloprid for an additional 2 days; 7dR + 4d AM, AAP for 8 h, retention on cotton leaves for 7 days, and then retention on leaves treated with acetamiprid for an additional 4 days; 7dR + 4d IC, AAP for 8 h, retention on cotton leaves for 7 days, and then retention on leaves treated with acetamiprid for an additional 4 days; 7dR + 2d HS, AAP for 8 h, retention on cotton leaves for 7 days, and then retention under heat stress for an additional 2 days.

