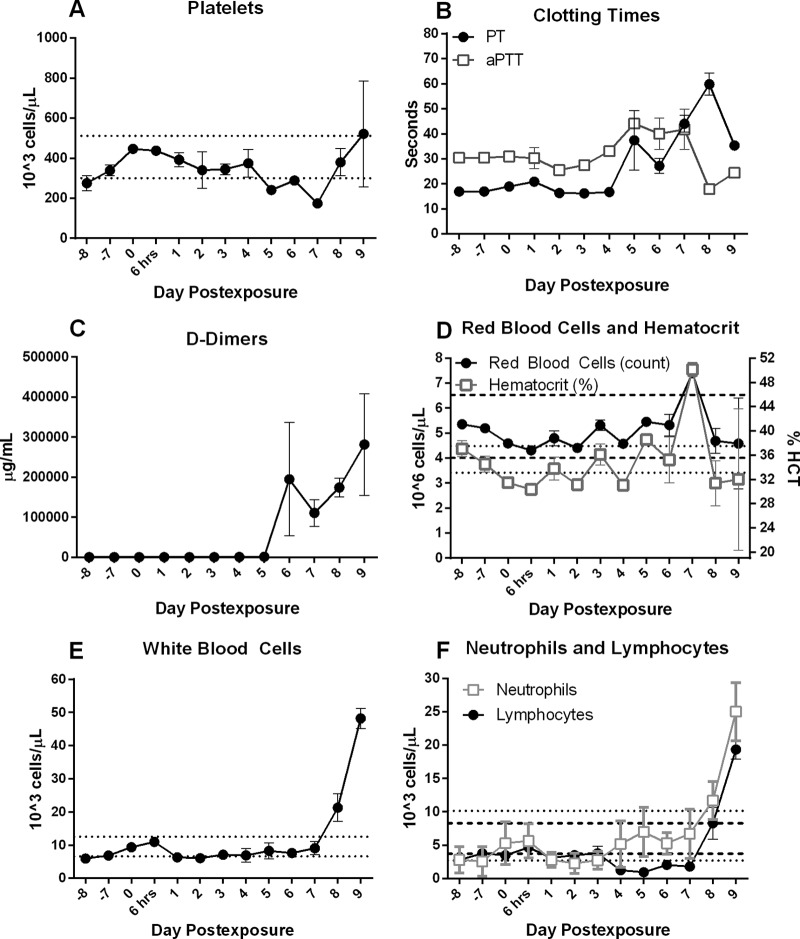
FIG 3.
Hematology and coagulation profiles. Platelet deregulation (A), increases in clotting times (B), and the presence of D-dimers (C) illustrate a disruption in normal coagulation function. (D) Red blood cell and hematocrit remained relatively normal throughout the study, with increases attributed to splenic contraction and whole-body dehydration. Increasing total white blood cell counts (E) and neutrophil and lymphocyte counts (F) demonstrate progressive leukocytosis and lymphocytosis. Dashed lines represent ranges for RBC and lymphocytes on respective graphs. Dotted lines represent range values for hematocrit and neutrophils on respective graphs. Each data point represents the average value for all samples that were analyzed at that time point.

