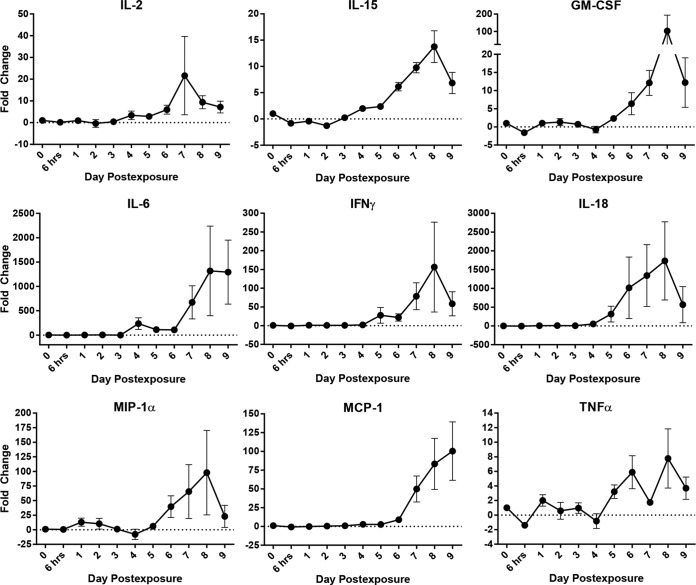
FIG 5.
Cytokines and chemokines. Data are the change (fold) over baseline (dotted lines) for selected recruitment and proinflammatory cytokines and chemokines. Changes indicate a Th1 immune response late in disease. Each data point represents the average value for all samples that were analyzed at that time point.

