


FIG 4.
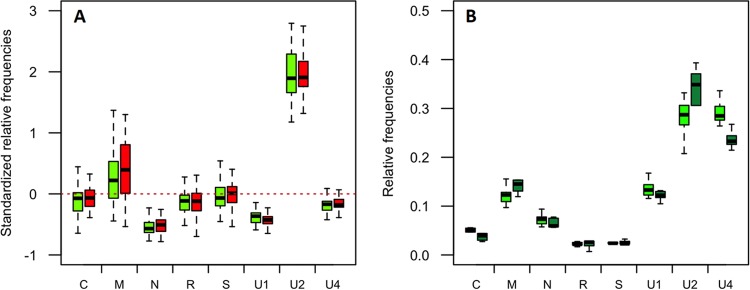
FBNSV genome formula within aphids and transmission success. (A) Comparison of the relative frequencies of FBNSV segments in individual A. pisum aphids that efficiently transmitted the virus (green box plots; n = 54) in the experiment described in the legend to Fig. 1 and in those that did not (red box plots; n = 63). The standardized relative frequency of each segment shown here corresponds to the relative frequency of a segment within aphids relative to that within the source plant. For each box plot, the bottom and top of the box are the first and third quartiles, the horizontal line within the box plots represents the median value of the distribution, and the whiskers delineate 1.5 times the distance between the first and third quartiles of the distribution. The red dashed line represents the “zero line,” where the relative frequencies of a segment are equal in aphids and in the source plant. No significant differences could be detected between the two aphid groups (see the text for details of statistical analysis). (B) Comparison of the relative frequencies of FBNSV segments in groups of 5 aphids of the vector species A. pisum (light-green box plots; n = 10) and of the nonvector species A. gossypii (dark-green box plots; n = 5), all caged and fed together on the same source plant. The relative segment frequencies shown here are not standardized and simply compare the FBNSV genome formulas in vector and nonvector species, regardless of that in the source plant. No statistical differences could be detected between the two aphid species, and the detailed results of the tests are described in the text.