Figure 2.

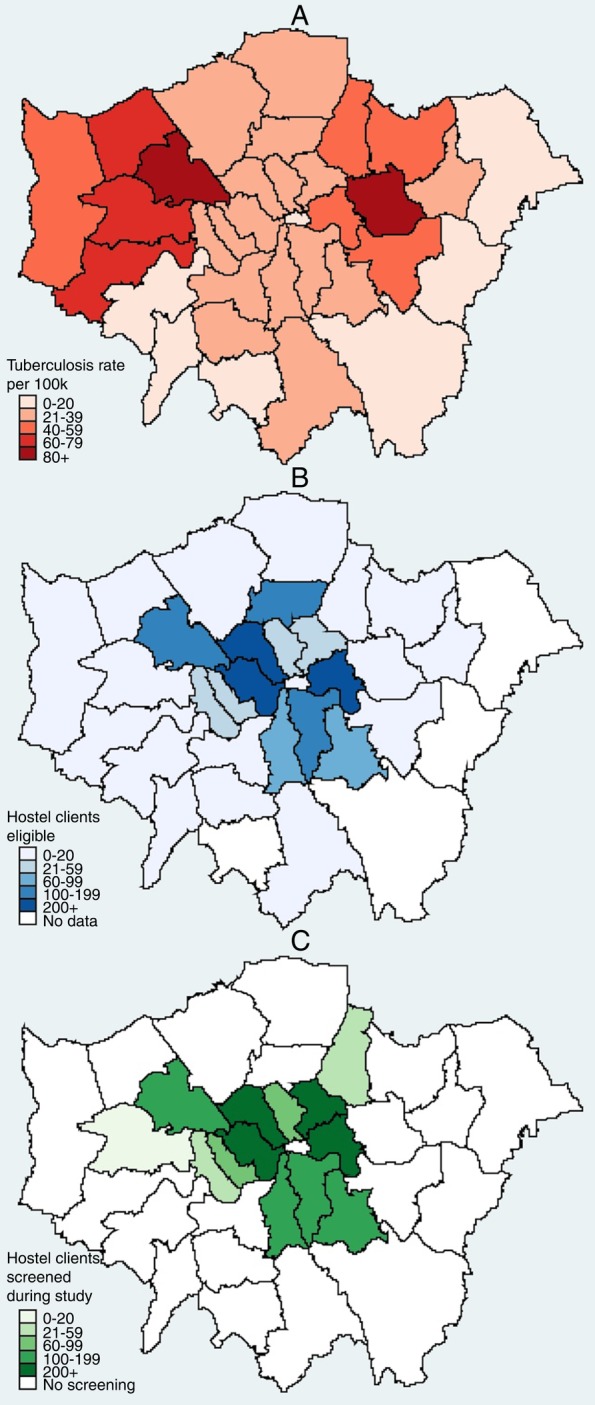
Maps of London by local authority detailing: rates of tuberculosis (A); total eligible clients at all homeless hostels (B); total number of clients screened at hostels as part of the study (C).

Maps of London by local authority detailing: rates of tuberculosis (A); total eligible clients at all homeless hostels (B); total number of clients screened at hostels as part of the study (C).