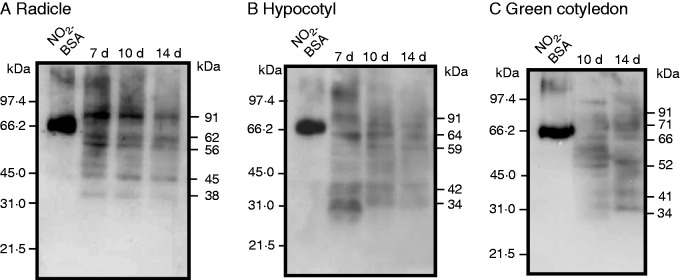
Fig. 6.

Tyrosine nitration pattern in radicles, hypocotyls and green cotyledons of pepper seedlings at different stages of development (7, 10 and 14 d old). (A) Radicle samples (5 μg per lane). (B) Hypocotyl samples (10 μg per lane). (C) Cotyledon samples (20 μg per lane). Commercial nitrated BSA (NO2-BSA; 2 µg of protein) was used as a positive control. Numbers to the right of the immunoblots indicate relative molecular masses of the detected immunoreactive bands, and relative molecular masses of the protein markers are shown to the left. Western blots were probed with a rabbit anti-nitrotyrosine polyclonal antibody at 1 : 8000 dilution.
