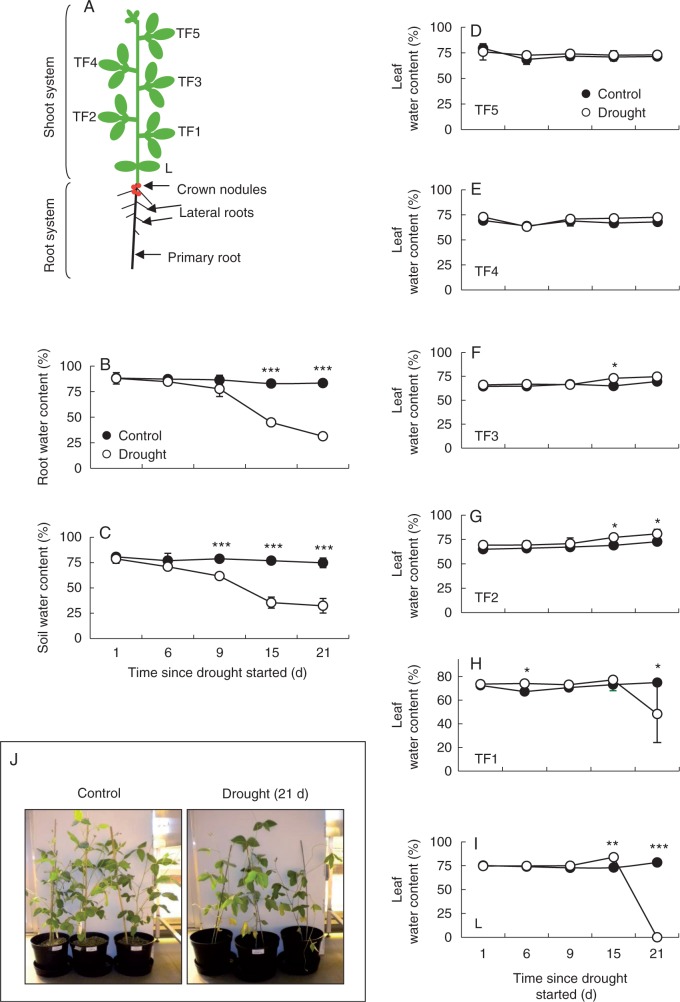
Fig. 1.
The effects of drought on leaf and soil water contents. (A) Schematic representation of a soybean plant indicating the different leaf ranks at the time of the experiment (L, unifoliolate leaves; TF, trifoliolate leaves). (B–J) root water content (B), soil water content (C), the water content of leaves at different ranks on the stem (D–I) and the phenotype of the plants after 21 d of treatment (J). Data are mean ± s.e. of three different samples. Statistical differences for each time point between the control and drought are denoted by asterisks (*P < 0·05, **P < 0·01, ***P < 0·001).

