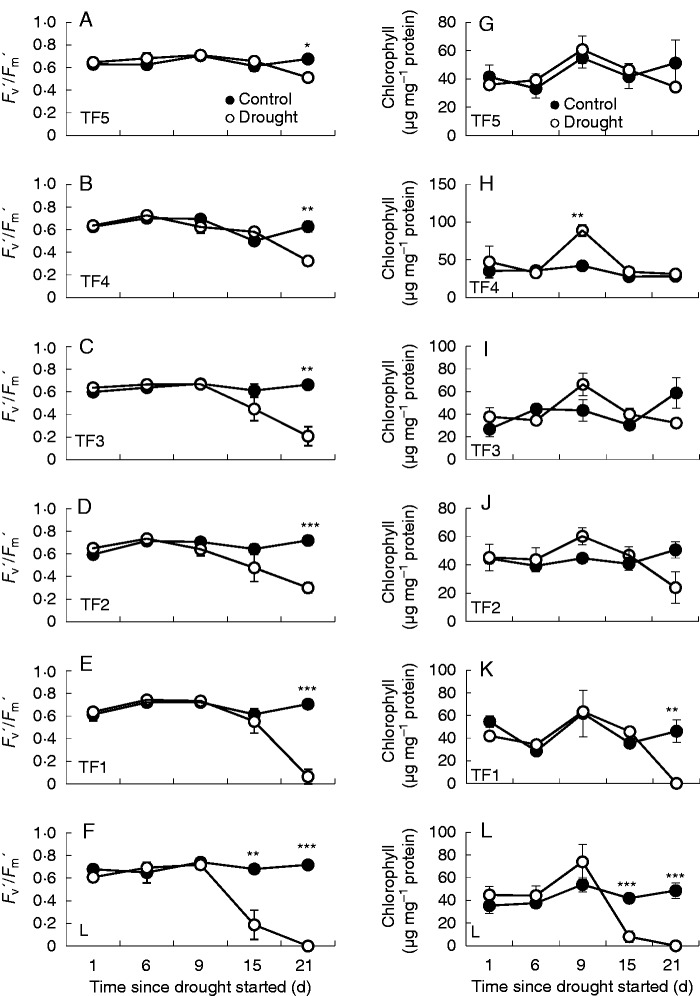
Fig. 2.
The effects of drought on photosystem II efficiency (Fv′/Fm′) in light-adapted leaves (A–F) and chlorophyll levels (G–L) in the different leaf ranks. Data are means ± s.e. of three different samples. Statistical differences for each time point between the control and drought are denoted by asterisks (*P < 0·05, **P < 0·01, ***P < 0·001).

