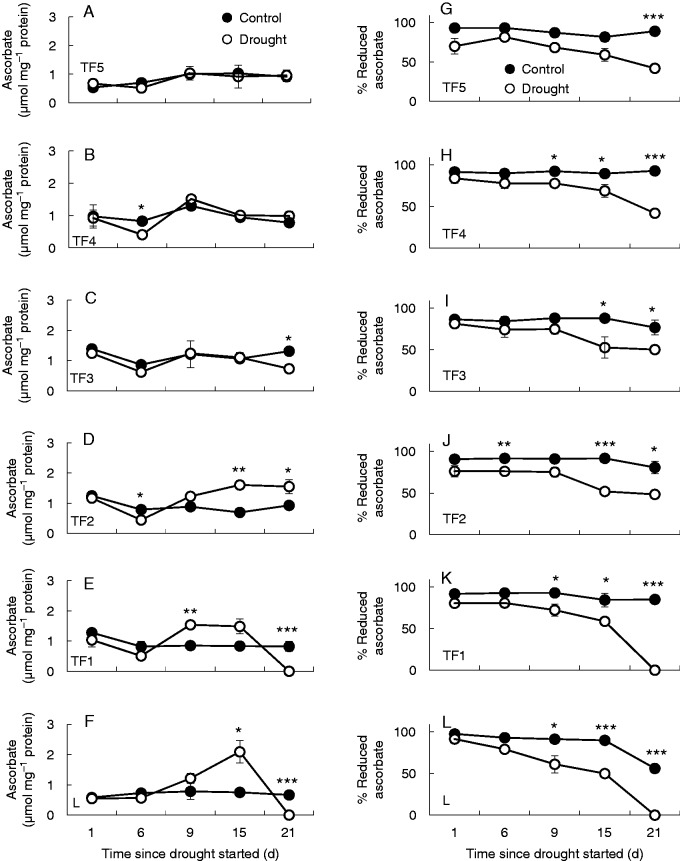
Fig. 4.
The effects of drought on the total (reduced plus oxidized) ascorbate levels (A–F) and on the percentage present in the reduced form (G–M) of the leaves at different leaf ranks. Data are the means ± s.e. of three different samples. Statistical differences for each time point between the control and drought are denoted by asterisks (*P < 0·05, **P < 0·01, ***P < 0·001).

