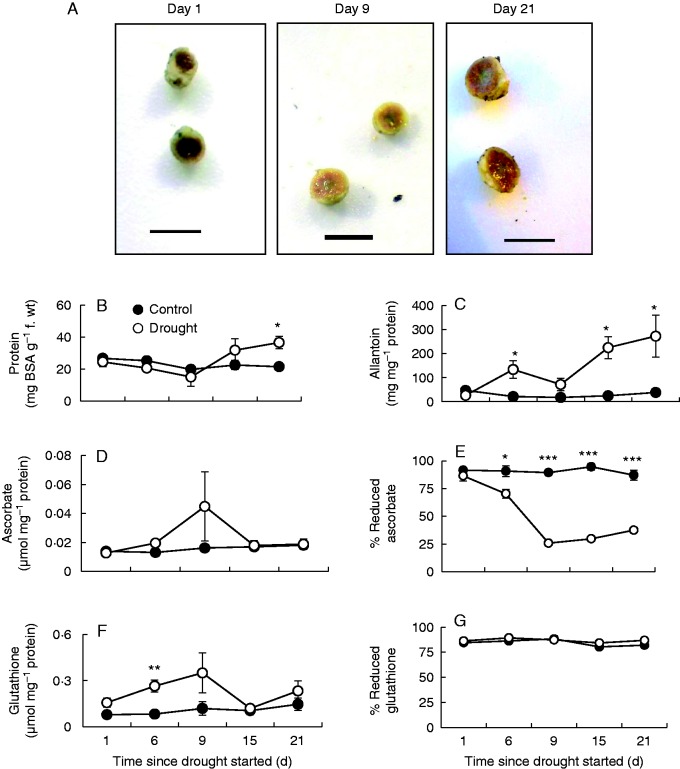
Fig. 6.
The effects of drought on nodule phenotype (A) 1, 9 and 21 d after the onset of drought treatment, (B) protein content, (C) ureide content, measured as allantoin, (D) total ascorbate, (E) the percentage of reduced ascorbate, (F) total glutathione plus homoglutathione content, and (G) percentage of reduced glutathione plus homoglutathione. In B–G data are the means ± s.e. of three independent nodule samples. Statistical differences for each time point between the control and drought are denoted by asterisks (*P < 0·05, **P < 0·01, ***P < 0·001). Scale bar = 0·5 cm.

