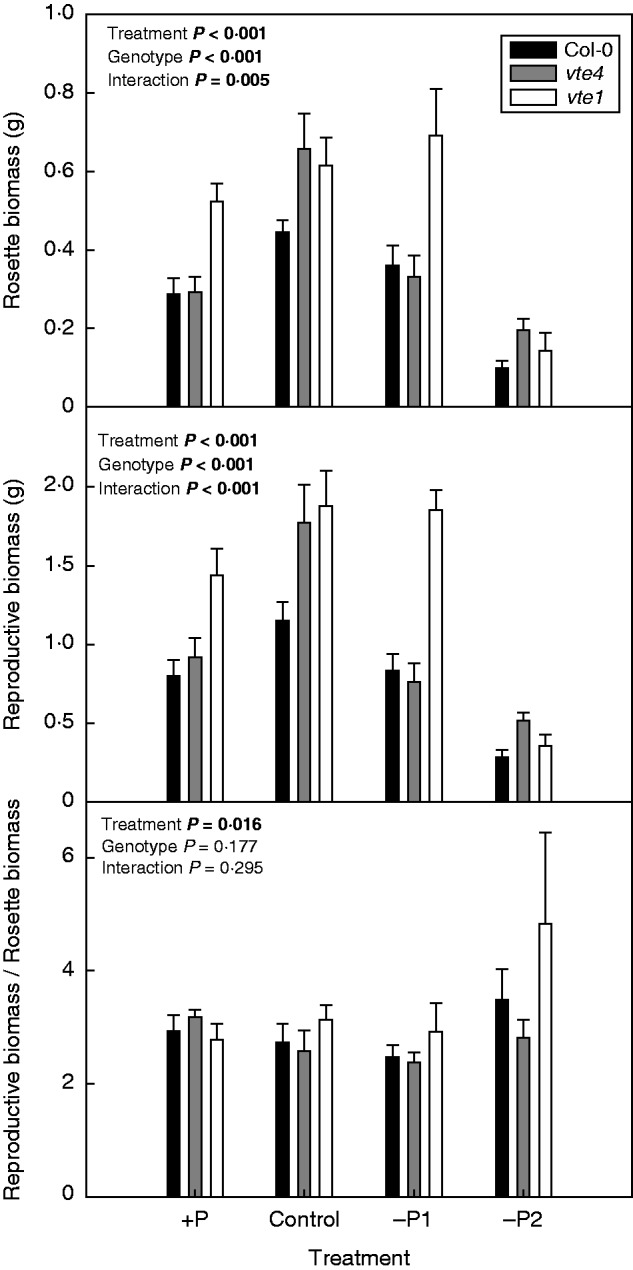
Fig. 2.

Rosette biomass, reproductive biomass and ratio of reproductive to rosette biomass in wild type (Col-0) and vte4 and vte1 mutants (see key) of A. thaliana grown under various P availabilities (+P, C, –P1 and –P2 represent various P concentrations in the nutrient solution; see Materials and methods for details). Data represent the mean ± s.e. of n = 35 individuals. Significant differences between treatments, genotypes and their interaction (treatment × genotype) were analysed by two-way ANOVA (P ≤ 0·05).
