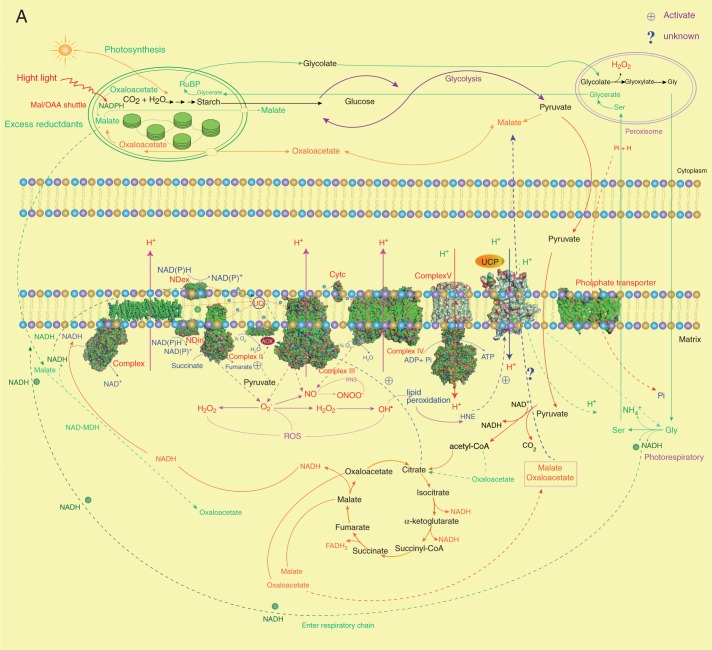
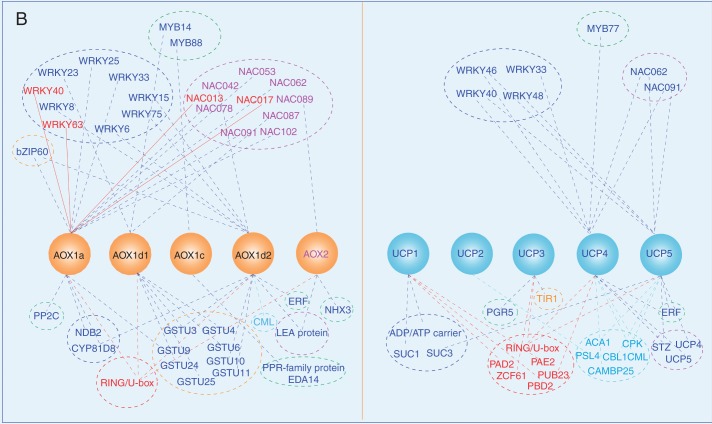
Fig. 2.
The intraorganelle metabolic association linked by the MEDP (A) and co-regulation gene network (B). (A) The major mitochondrial respiratory complexes (MCRs) and AOX are shown as crystal structures. For each MCR protein, structures are retrieved from the Protein Data Bank (PDB): complex I, PDB 3M9S (Efremov et al., 2010); complex II, PDB 1ZOY (Sun et al., 2005); complex III, cytochrome bc1, PDB 3H1J (Iwata et al., 1998); complex IV, cytochrome c oxidase, PDB 1OCO (Yoshikawa et al., 1998); complex V, F0, PDB 1C17 (Rastogi and Girvin, 1999), F1, PDB 1E79 (Gibbons et al., 2000); yeast NADH dehydrogenase, PDB 4G9K (Iwata et al., 2012); phosphate transporter, PDB 4J05 (Pedersen et al., 2013); AOX, PDB 3VV9 (Shiba et al., 2013); UCP, PDB 2LCK (Berardi et al., 2011). (B) To obtain gene sets of co-expressed MEDP members (Supplementary Data Tables S1–S5), each MEDP member is selected, respectively, to run the Perturbations tool, Co-Expression tool and Biclustering tool of the Genevestigator database (Zimmermann et al., 2004; Hruz et al., 2008). First, conditions that are relevant for each MEDP target gene are identified by using the Perturbations tool from the condition search tools to create samples based on a fold change value of 2 and P-value cut-off of 0·05, and then to correlate across these perturbations in the Co-Expression tool. The resulting co-expressed gene sets are used to produce the co-regulation gene network.


