Fig. 3.
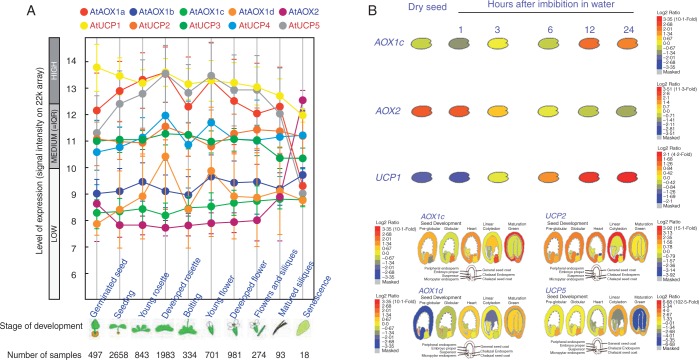
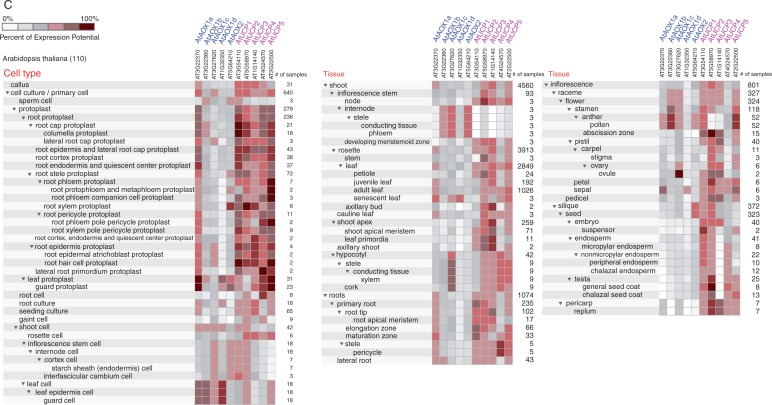
Analysis of MEDP gene expression during development and organ distribution. (A) Genevestigator expression map describing the expression patterns of MEDP members during arabidopsis development. Growth stages from seed germination to senescence are arbitrarily grouped into sub-categories based on Boyes standard (Boyes et al., 2001). Each category contains averaged raw signal data and the standard error derived from all ATH1 chips hydridized with RNA from the corresponding growth stages in the Genevestigator database, including all organs available at that stage. Each of the arabidopsis growth stages is shown, and plant age in each category is indicated underneath the graph, as is the number of chips contributing to each category. Error bars represent the standard error. Data were retrieved from the Genevestigator database (https://genevestigator.com/gv/plant.jsp) using the Development tool. (B) Transcript expression of the MEDP members in wild-type arabidopsis. Relative expression level of MEDP members in plant tissues and organs and in particular cell types. Data were obtained from the Genevestigator database using the condition search tool set, the Anatomy tool. (C) The expression level of MEDP members during seed development and germination. The log2 ratio graphs on the right indicate the highest level of expression in red and the lowest level of expression in blue for each gene. The data were retrieved from the BAR database (http://bar.utoronto.ca/).


