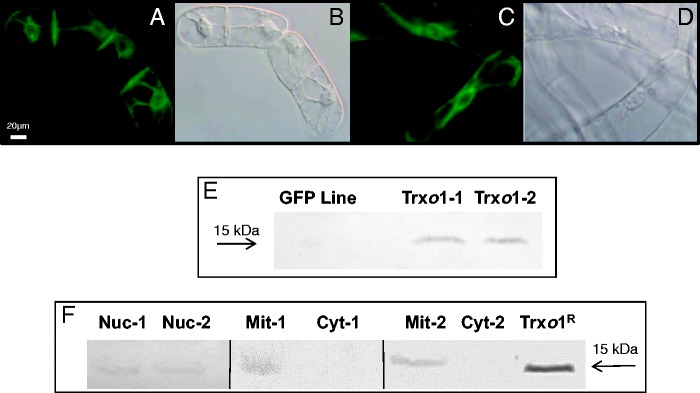
Fig. 1.

GFP visualization by fluorescence microscopy and phase contrast imaging in two lines of transformed TBY-2 cells: (A, B) Trxo1-1; (C, D) Trxo1-2. Scale bar = 20 µm. (E) Western blot analysis of cell extracts from GFP and PsTrxo1 lines of TBY-2 cells using 50 µg of soluble proteins separated by denaturing electrophoresis on a 12 % (w/v) polyacrylamide gel and hybridized with a rabbit anti-PsTrxo1 antibody in cell extracts of GFP and PsTrxo1 lines of TBY-2 cells. (F) Western blot analysis of 30 μg of soluble proteins from nuclear (Nuc), mitochondrial (Mit) and cytoplasmic (Cyt) fractions of two lines of Trxo1-over-expressing cells. PsTrxo1 recombinant protein was used as positive control. The molecular mass standard is shown on the right (kDa). The loading control of the blot in (F) using Ponceau staining is presented as Supplementary Data Fig. S1.
