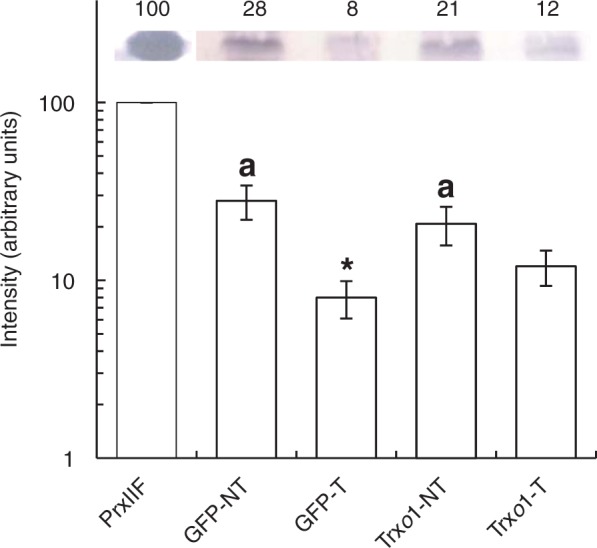
Fig. 10.

Western blot analysis of the protein level of PrxIIF in GFP and Trxo1 lines of tobacco BY-2 cells, non-treated (NT) and treated (T) with 35 mm H2O2, after 4 h. A representative blot is shown for recombinant PsPrxIIF as positive control (100 %). Band intensity (arbitrary units; note log scale) is represented in the graph after quantification using image analysis software (GeneTools, Syngene, Cambridge, UK).
