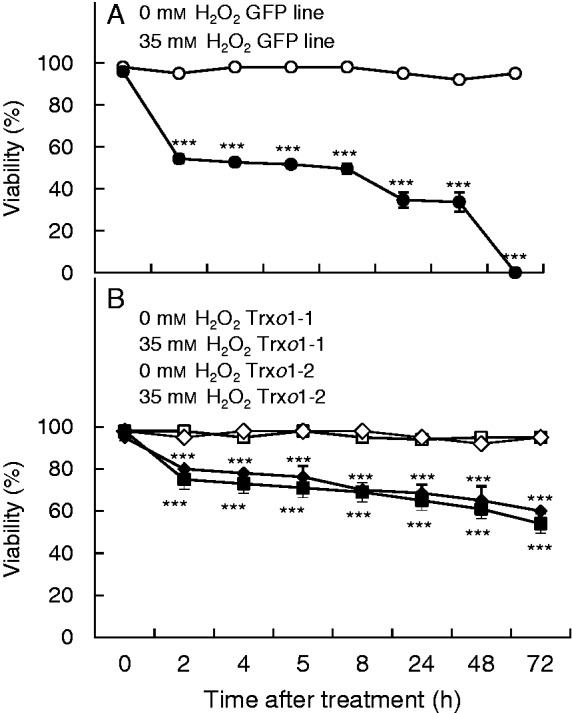
Fig. 3.

Effect of 35 mm H2O2 on cell viability of (A) GFP and (B) Trxo1 lines 1 and 2 of TBY-2 cells. H2O2 was added at day 5 of growth and cell viability was analysed over time. Values represent mean ± s.e. of ten experiments. ***Difference between non-treated and H2O2-treated sample of each line was significant at the 0·1 % level.
