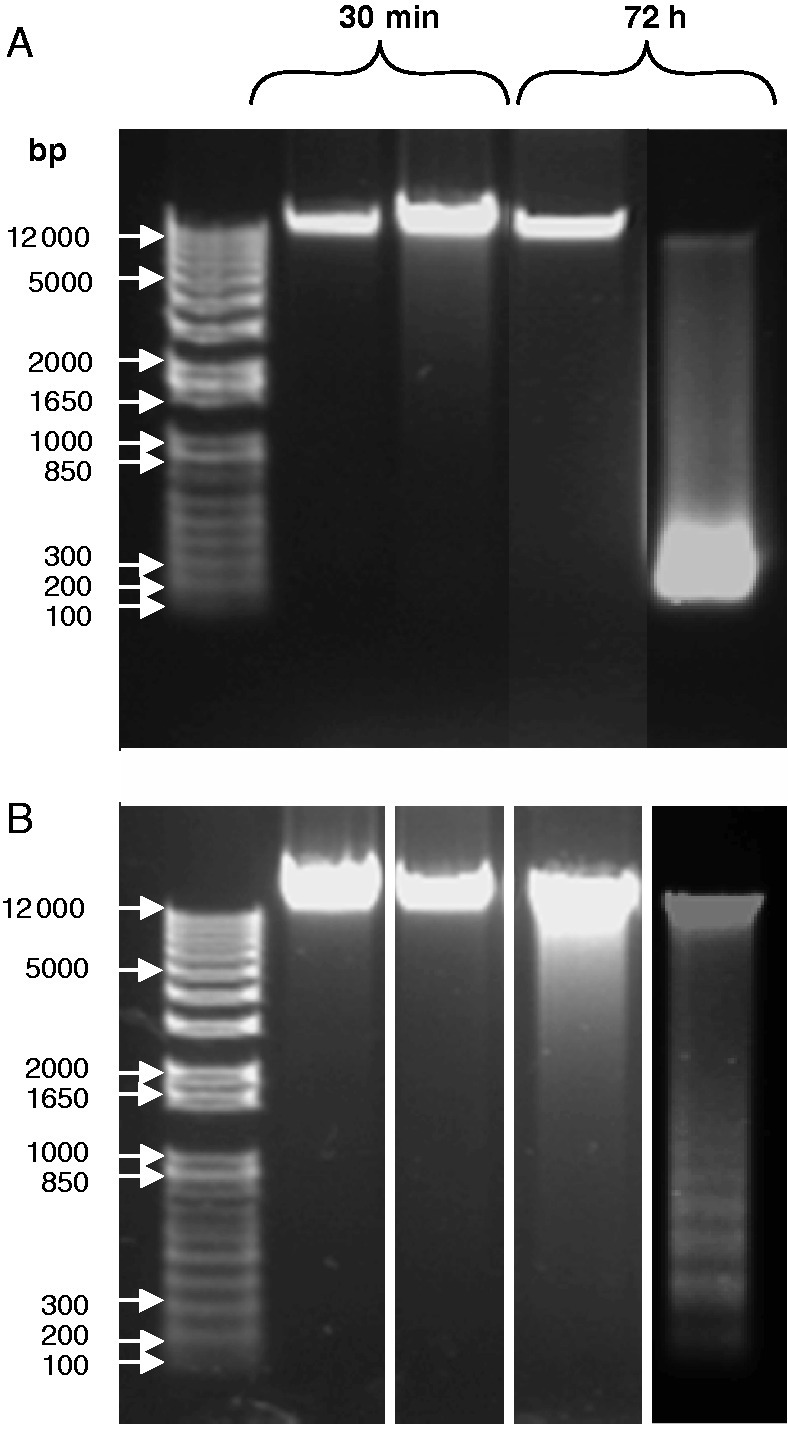
Fig. 5.

Analysis of DNA fragmentation. DNA was extracted from (A) the GFP line and (B) the Trxo1 line of tobacco BY-2 cells, non-treated (NT) and treated (T) with 35 mm H2O2 and collected after 30 min and 72 h of treatment. A representative electrophoretic run in which 100 μg DNA was loaded for each cell line is presented, and a size standard is shown on the left (bp).
