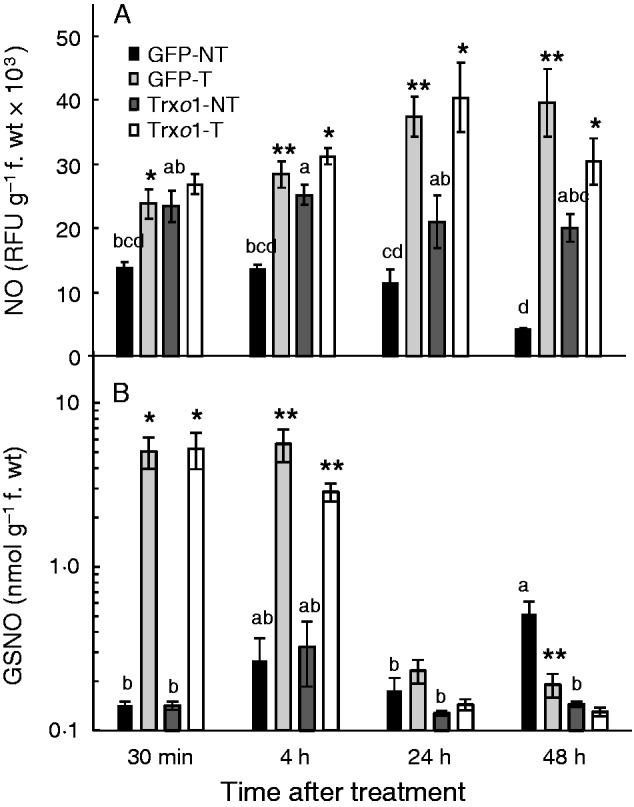
Fig. 7.

Content of (A) NO and (B) GSNO of GFP and Trxo1 lines of tobacco BY-2 cells, non-treated (NT) and treated (T) with 35 mm H2O2. Values represent mean ± s.e. of three experiments. Note log scale in (B). Means for each non-treated sample that do not have a common letter are significantly different by Tukey’s test at P < 0·05. *, **, *** indicate differences between non-treated and H2O2-treated samples that are significant at the 5, 1 and 0·1 % level, respectively. RFU, relative fluorescence units.
