Fig. 6.
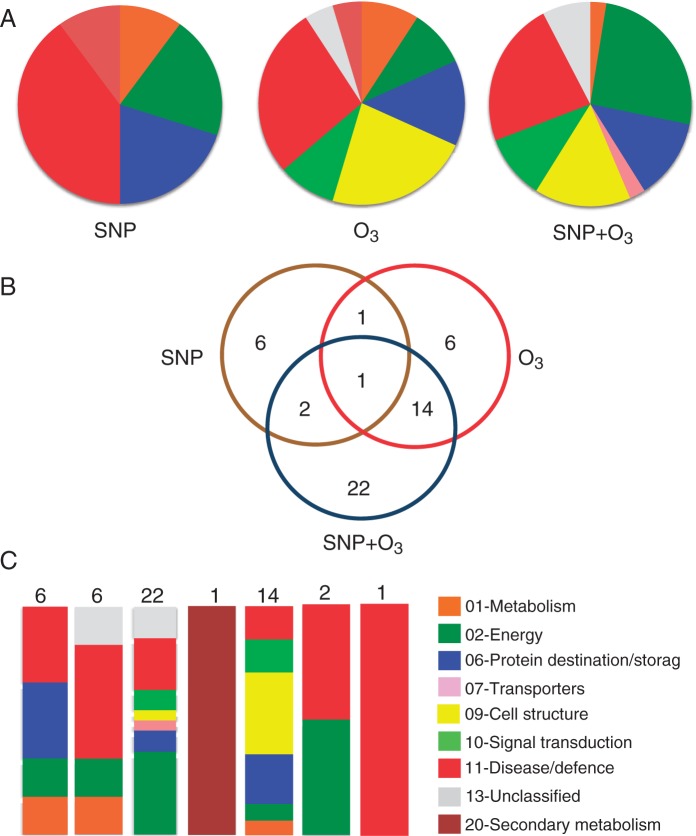
Distinct and common kiwifruit proteins targeted by SNP and O3. (A) Functional classification of all identified proteins by LC-MS/MS in kiwifruit exposed to post-harvest treatments. The colour code represents the functional classification as presented in Fig. 5 and labelled in (C). (B) Venn diagram of proteins identified in the three post-harvest treatments. The total number in each unique or overlapping set of proteins is shown. (C) Graphical representation of the functional categories for each set of unique or overlapping proteins presented in (B).

