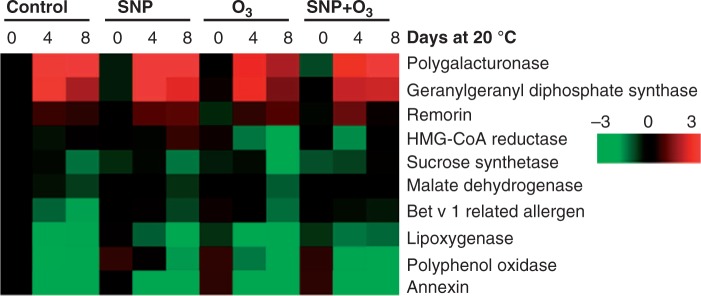
Fig. 7.

Temporal expression pattern of kiwifruit genes at different ripening stages. Heat diagram showing the expression profiles of selected genes at different ripening times following 6 months cold storage. The relative mRNA abundance was analysed by quantitative real-time PCR using three biological replications. Upregulation is indicated in red; downregulation is indicated in green. A scale of colour intensity is presented. Actual data are provided in Supplementary Data Fig. S4.
