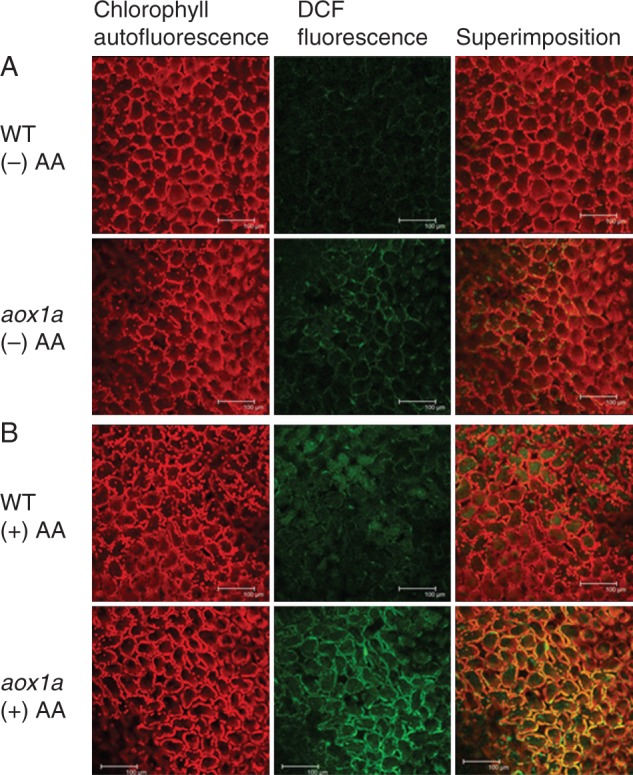
Fig.6.

Measurement of ROS formation in WT and aox1a from (A) control (Tween-20) and (B) treated (20 µm AA in Tween-20) leaf discs pre-illuminated (6 h) at a PPFD of 50 µmol m−2 s−1 at 25 °C using confocal laser scanning microscopy. Chlorophyll autofluorescence is shown in red, DCF fluorescence, which represents cellular ROS, is shown in green and superimposed images representing chloroplastic ROS in pseudo orange/yellow. All scale bars = 100 µm.
