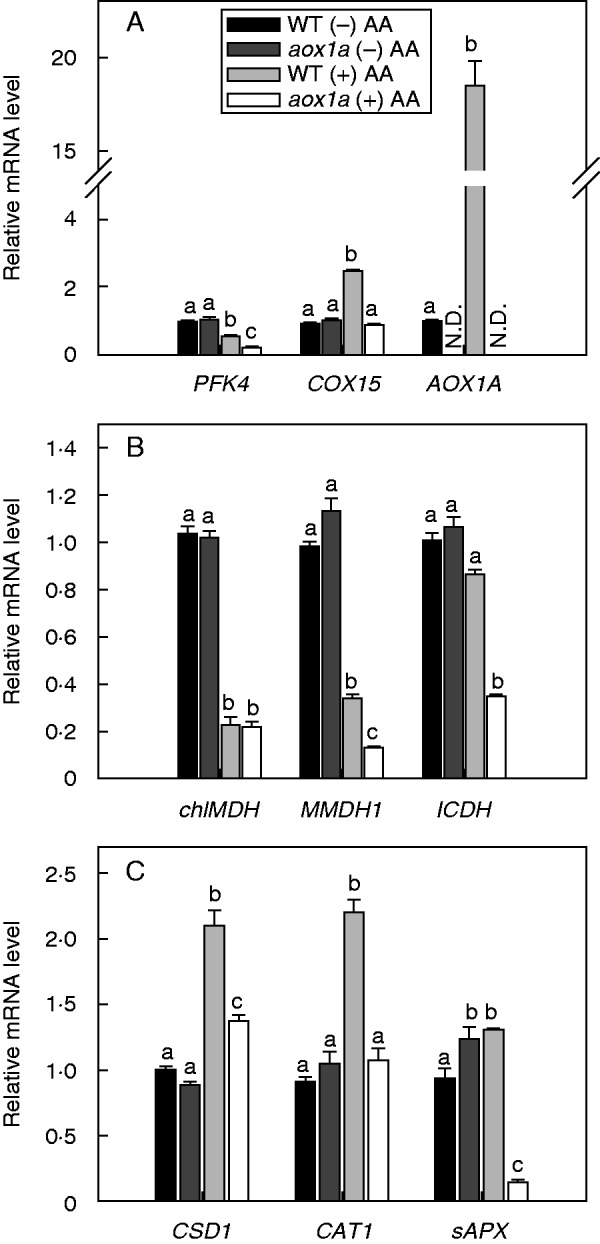
Fig.8.

Gene expression profiles in WT and aox1a from control (Tween-20) and treated (20 µm AA in Tween-20) leaf discs pre-illuminated (6 h) at a PPFD of 50 µmol m−2 s−1 at 25 °C: (A) respiratory enzymes (PFK4, COX15 and AOX1A), (B) malate–OAA shuttle enzymes (MMDH1, chlMDH and ICDH) and (C) antioxidative enzymes (CSD1, CAT1 and sAPX). N.D. denotes expression of gene was not detected (A). Transcript abundance was quantified by the ΔΔCT method using UBQ5 as a reference gene. Further details were as described in Materials and methods. Different lower-case letters indicate statistically significant differences (P < 0·05).
