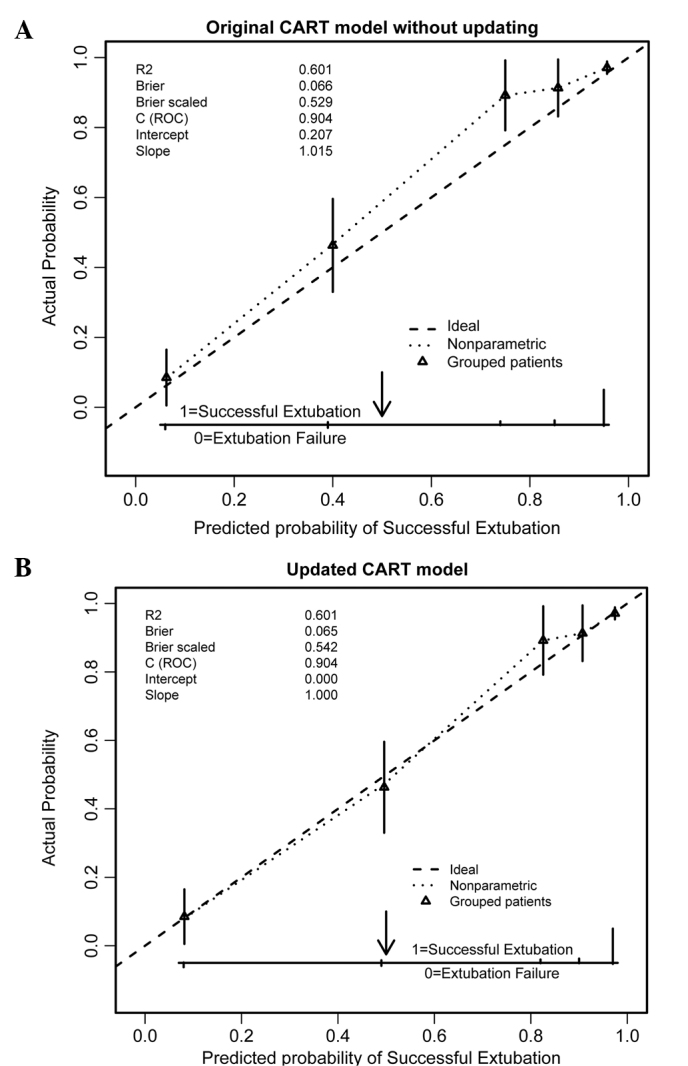
Figure 2.

Calibration plots of the CART models for predicting successful extubation in the validation cohort (n=530). Predicted probabilities are on the x-axis and observed outcomes on the y-axis. The triangles indicate the actual probabilities by quintiles of predicted probabilities, with vertical lines representing 95% confidence intervals. The diagonal dashed line represents the ideal calibration (intercept=0, slope=1). (A) Original CART model without updating and (B) the CART model updated with the simple re-calibration method. Note that the original CART model's predicted probabilities in the validation set are systematically too low and the resulting updated model showed excellent calibration. CART, classification and regression tree.
