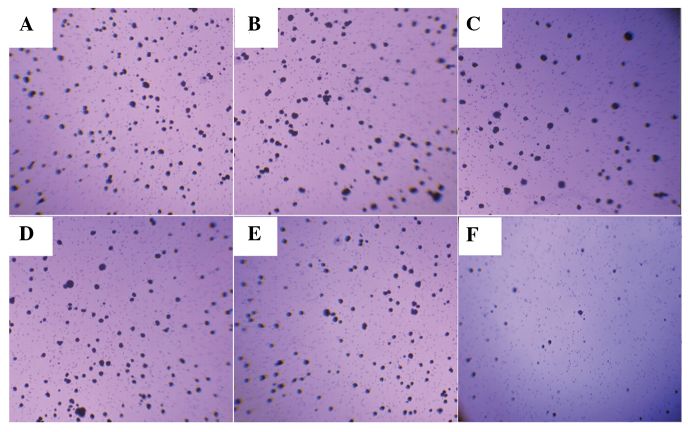
Figure 3.
Anchorage-independent growth comparison of parental, pBK-CMV-HA-EBP50- and pBK-CMV-HA-transfected cells as evaluated by colony formation assay. (A-C) Representative data of SW1990 cells: (A) SW1990; (B) HA-SW1990 and; (C) EBP50-SW1990 cells. (D and E) Representative data of PANC-1 cells: (D) PANC-1; (F) HA- PANC-1 and; (F) EBP50- PANC-1 cells. Magnification, x100. EBP50, ezrin-radixin-moesin-binding phosphoprotein 50; HA-SW1990, SW1990 cells transfected with pBK-CMV-HA empty vector; EBP50-SW1990, SW1990 cells transfected with pBK-CMV-HV-EBP50.

