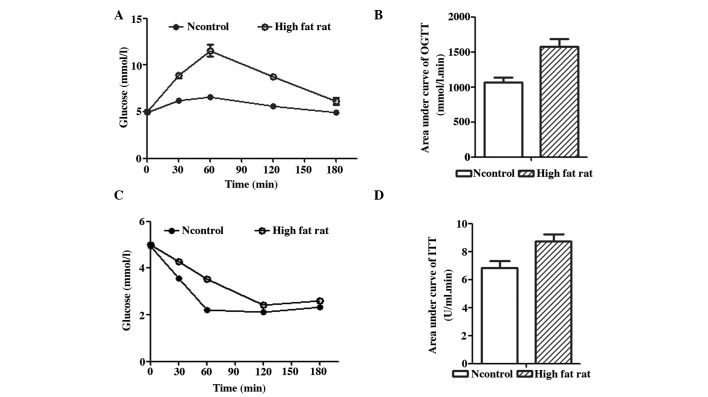
Figure 2.
OGTT and ITT results. (A) OGTT test results of rats after feeding with a high-fat diet for 8 weeks. (B) The area under the curve of the rats fed a high-fat diet was significantly higher than that rats fed with a normal diet (F=62.56; P<0.01). In the ITT test, (C) the plasma glucose levels of the rats fed a high-fat diet decreased more slowly than those of the rats fed with a normal diet fed rats after insulin injection; (D) the area under the curve of the rats fed a high-fat diet was also higher than that of the rats fed with a normal diet (F=28.68; P<0.01). OGTT, oral glucose tolerance test; ITT, insulin tolerance test; Ncontrol, normal control.

