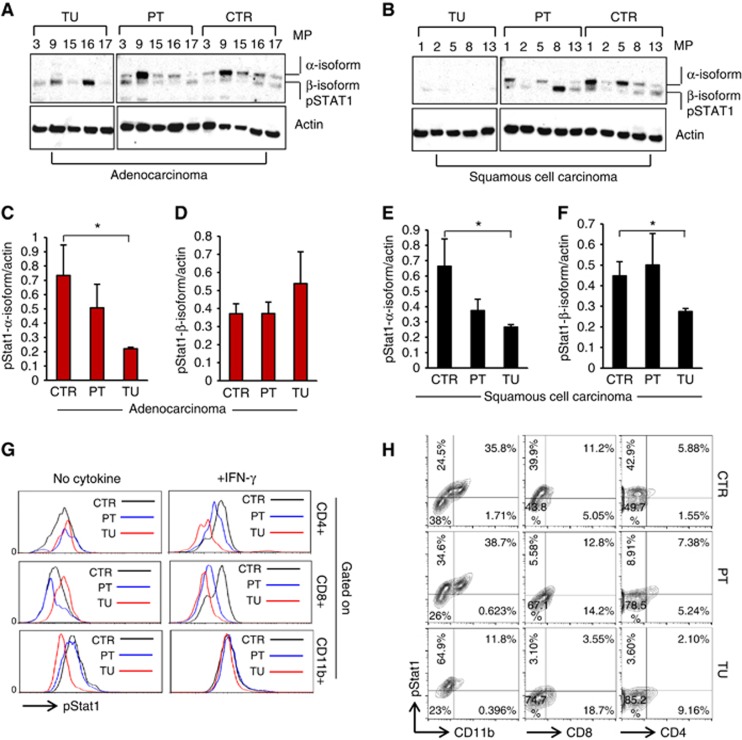
Figure 4.
Reduced STAT1 phosphorylation in the tumoral region of NSCLC. (A–F) Western blot analysis of pSTAT1 and actin expression in lung tissue samples from the tumoral, peri-tumoral and control region of patients with adenocarcinoma (ADC) (NControl=5; NPeri-tumoral=5, NTumoral=5). Bar charts show mean values of the protein expression levels of pSTAT1 α-Isoform (C and D) and pSTAT1 β-Isoform (E and F) relative to actin levels in ADC and in SCC, respectively. (G) Flow cytometry analysis of pSTAT1+ cells in the tumoral, the peri-tumoral and the control lung region of one representative patient with NSCLC. pSTAT1 staining was performed with the lung cell suspensions after 20 min of incubation at 37 °C in the presence or absence of IFN-γ. pSTAT1+ cells were gated on CD4+, CD8+ or CD11b+ cells, respectively. (H) Flow cytometry analysis of pSTAT1+CD4+ and pSTAT1+CD8+ T cells gated on lymphocytes as well as pSTAT1+CD11b+ cells gated on big cells in the control, the peri-tumoral and the tumoral lung region of one representative patient with NSCLC. Data are shown as mean values±s.e.m. using Student's t-test *P=0.05.

