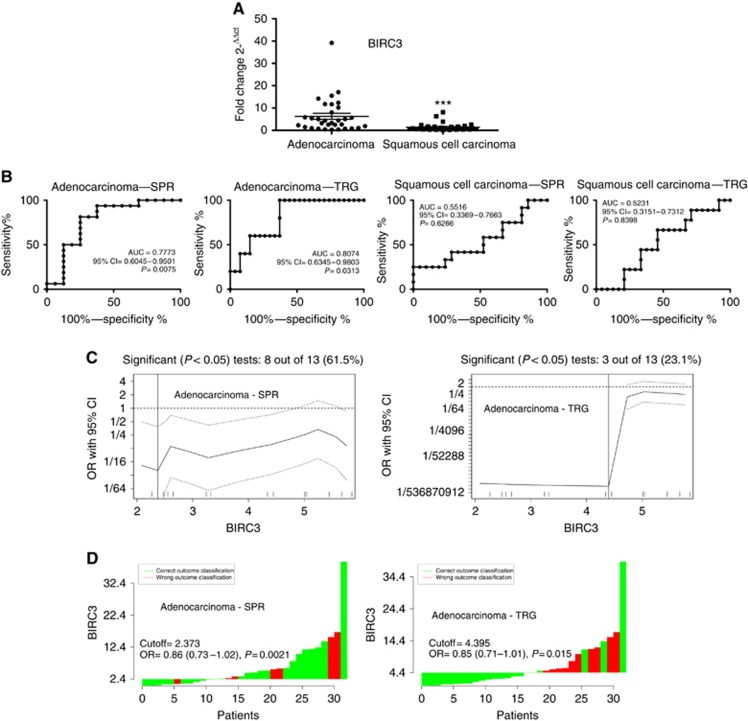
Figure 4.
Correlation between Baculoviral inhibitor of apoptosis (IAP) repeat containing (BIRC)3 expression and the response to preoperative chemoradiotherapy treatment in oesophageal and oesophagogastric junction adenocarcinoma and squamous cell carcinoma patients. (A) Distribution of BIRC3 expression in oesophageal adenocarcinomas and squamous cell carcinomas. Horizontal bars denote means. ***P<0.0001 by Mann–Whitney test. (B) Receiver operator characteristic (ROC) curves for BIRC3 gene expression in adenocarcinomas and squamous cell carcinomas response evaluated either by Mandard's tumour regression grade (TRG) or by size-based pathological response (SPR) classifications. (C) Determination of cutoff thresholds of BIRC3 gene expression for oesophageal adenocarcinomas response evaluated either by TRG or by SPR classifications. All possible cutoff thresholds were considered and the corresponding odds ratios were calculated and plotted. Each data point in the line gives the corresponding OR and the 95% confidence interval (dotted lines) on the y axis. Vertical lines indicate the most significant split. (D) Waterfall plot, green and red bars represent cases with correct or wrong classification, respectively.

