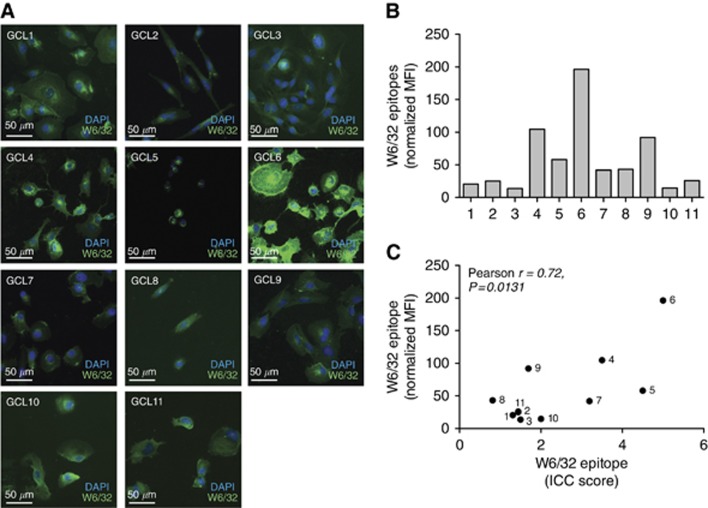
Figure 2.
GCLs express HLA-I on the cell surface. (A) Cells were analysed with conformational specific anti HLA-I antibody (W6/32). Two scientists independently scored the ICC stainings for surface expression of HLA-I from 0 to 5. Representative images from one out of two repeated immunocytochemistry experiments. (B) Expression of W6/32 reactive HLA-I at the cell surface analysed by flow cytometry. The graph shows one representative out of five repeated experiments. Bars are representing the MFI relative isotype. (C) Correlation plot with calculation of Pearson's correlation coefficient showing the significant correlation between flow cytometry and ICC analysis for surface-expressed HLA-I on GCL1-11.

