Figure 2.
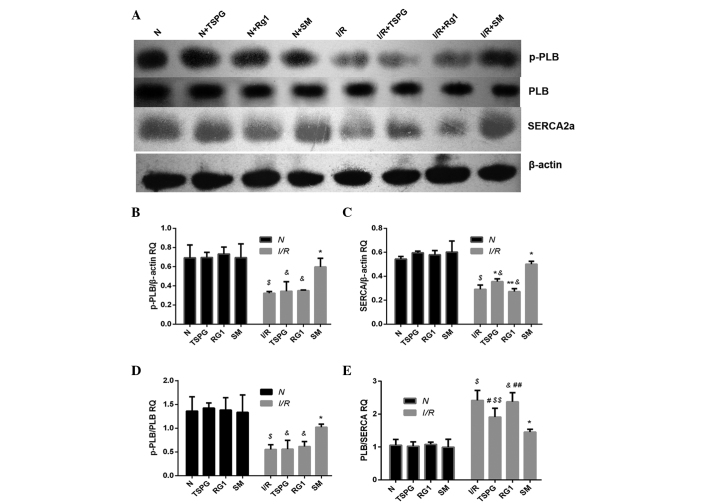
Effects of TSPG, Rg1 and SM on SERCA, p-PLB, p-PLB/PLB and PLB/SERCA levels following I/R in cardiomyocytes. (A) Western blot analysis of SERCA, p-PLB, PLB and β-actin levels. (B-E) Quantification of (B) p-PLB levels, (C) SERCA levels, (D) p-PLB/PLB ratio and (E) PLB/SERCA ratio. Data are expressed as the mean ± standard deviation (n=4). $P<0.01 vs. N; &P<0.01 and $$P<0.05 vs. I/R + SM; *P<0.01 and #P<0.05 vs. I/R; **P<0.01 and ##P<0.05 vs. I/R + TSPG. N, normoxia; TSPG, total saponins of Panax ginseng; Rg1, ginsenoside Rg1; SM, Shenmai injection; I/R, ischemia/reperfusion; PLB, phospholamban; p-PLB, phosphorylated-PLB; SERCA, sarco/endoplasmic reticulum Ca2+ ATPase; RQ, relative quantification.

