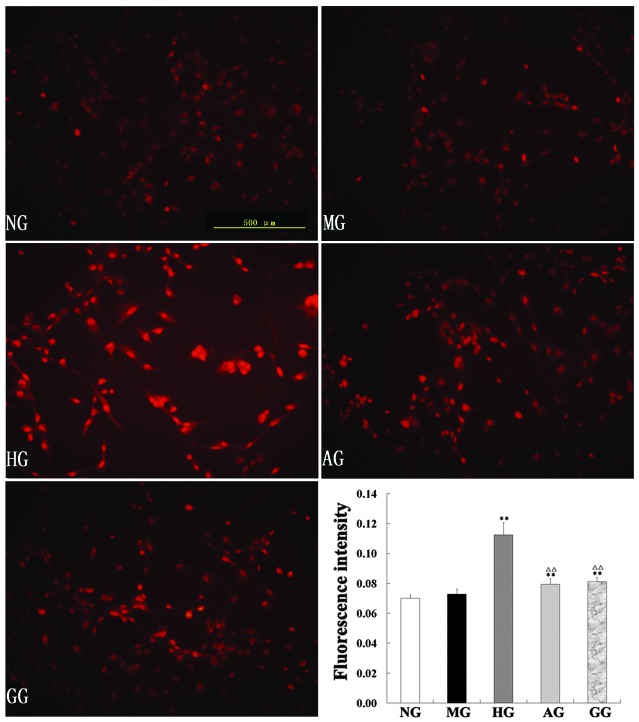
Figure 4.
Reactive oxygen species levels of aortic endothelial cells assessed by dihydroethidium staining under a fluorescence microscope. Image-Pro Plus 6.0 image analysis software was used to analyze the results. Images are representative of each group. **P<0.01 vs. NG; ∆P<0.05 and ∆∆P<0.01 vs. HG. NG, normal group; MG, mannitol group; HG, high glucose/hypoxia group; AG, allicin group; GG, PKC inhibitor (GF109203x) group.

