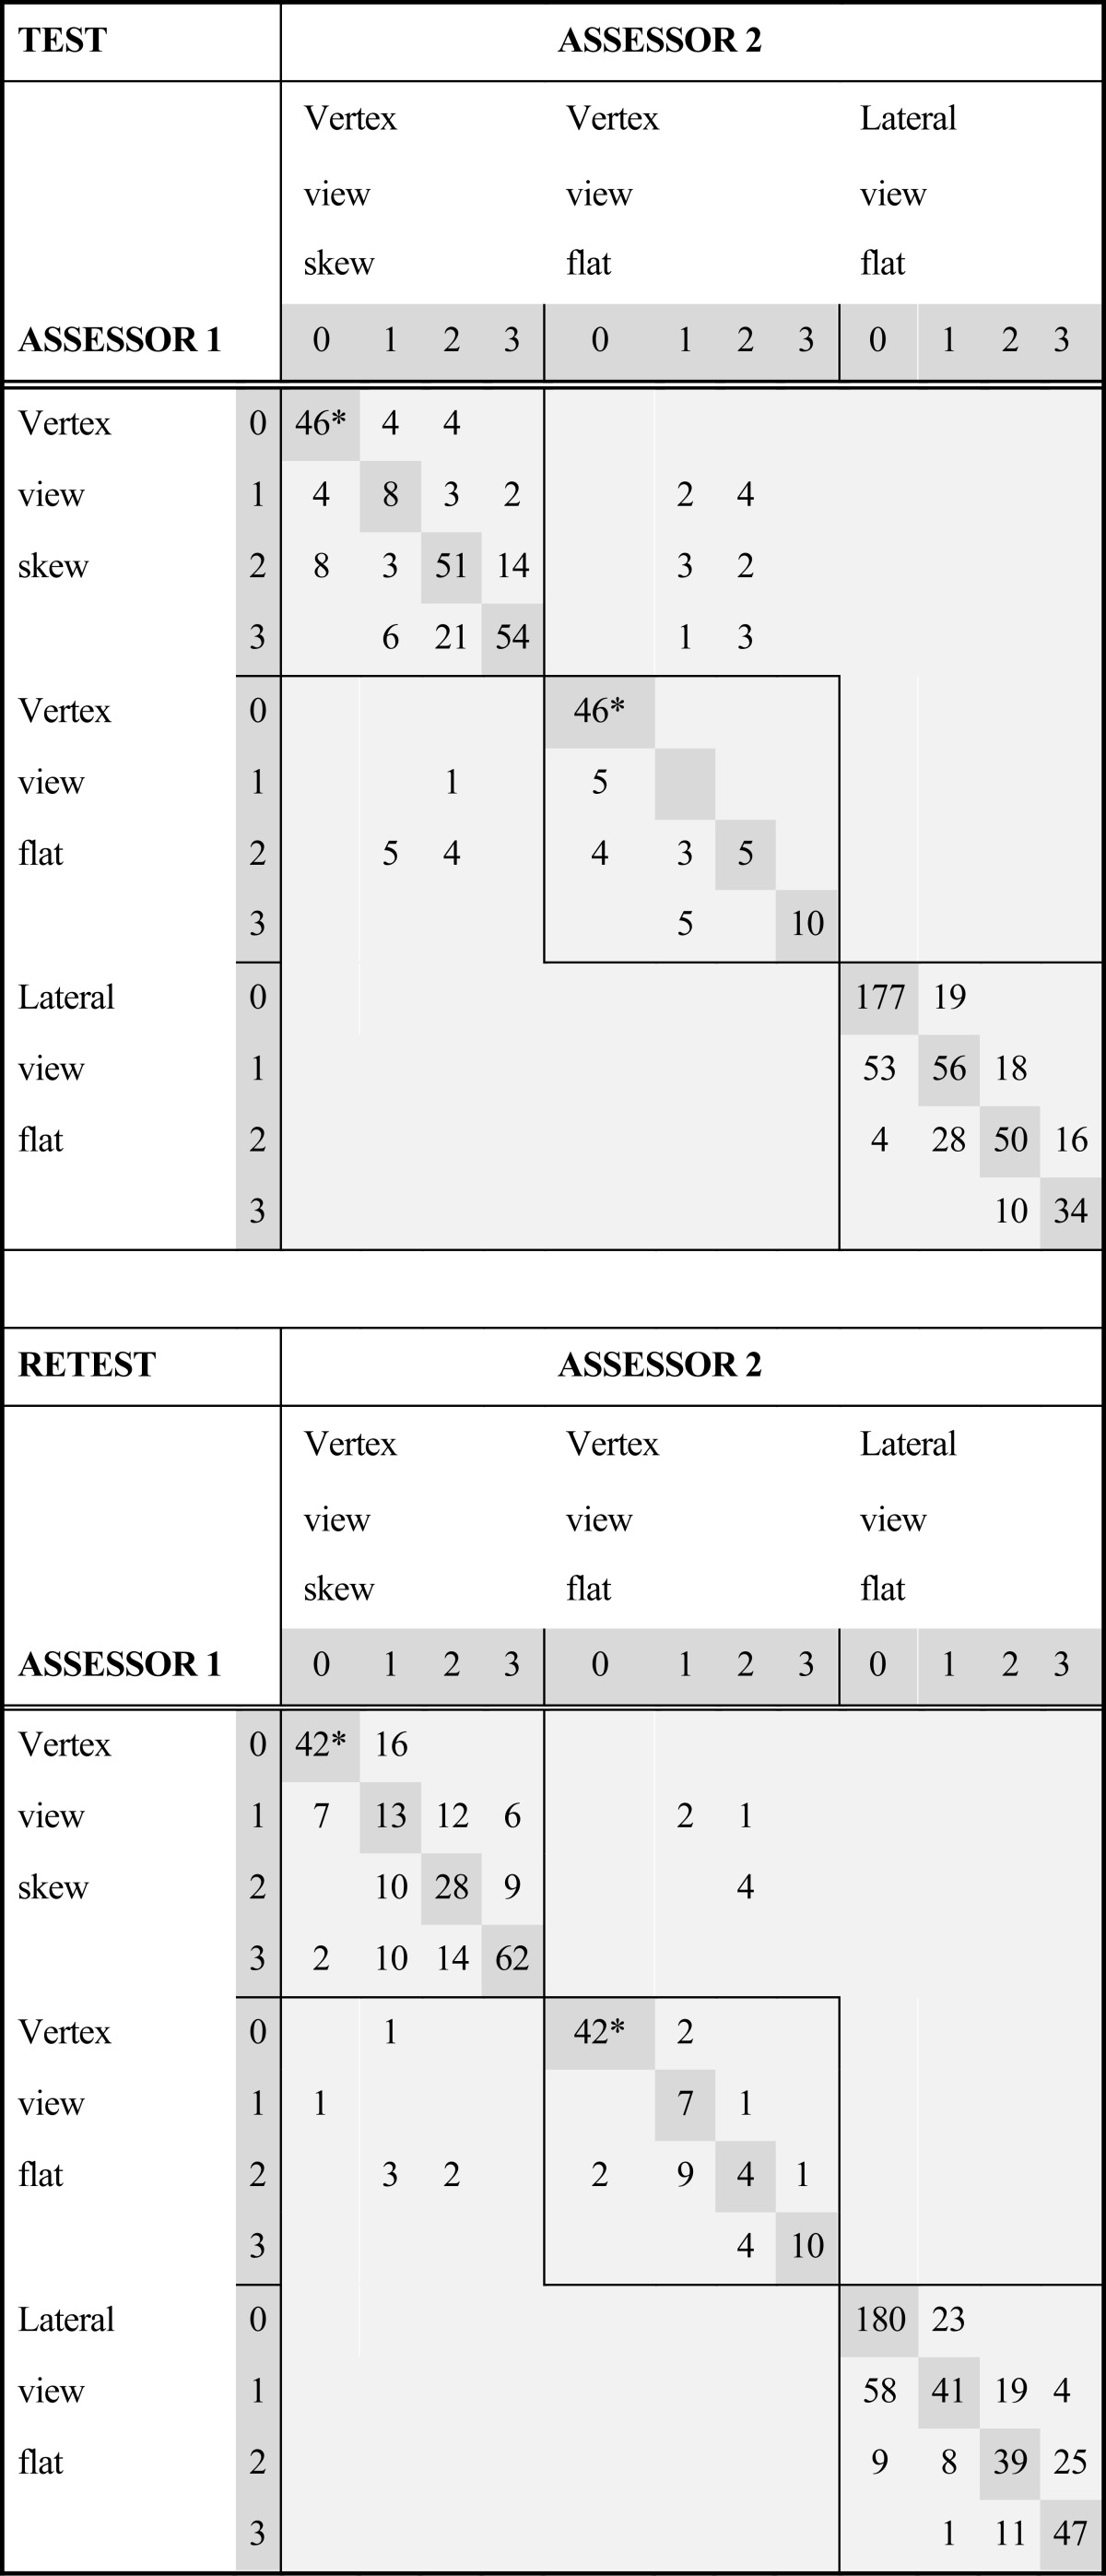
Table 2.
Frequencies of inter-rater agreement sorted by type of asymmetry in 50 photographs when 6 assessors judged cranial asymmetry on 2 occasions.
 |
Degree of asymmetry: 0 = none, 1 = mild, 2 = moderate and 3 = severe.
Perfect agreement is expressed as frequencies on the diagonal. Disagreements regarding degree of asymmetry are expressed as frequencies in non-diagonal cells where increased distance from diagonal indicates stronger disagreement. Frequencies in areas outside four by four blocks indicate a photograph was judged as skewed by one assessor and flat by another.
* Counts included in 2 cells when a photograph was judged to have no asymmetry since that indicates both 0 skew and 0 flat agreement. These counts are only used once in calculations.
