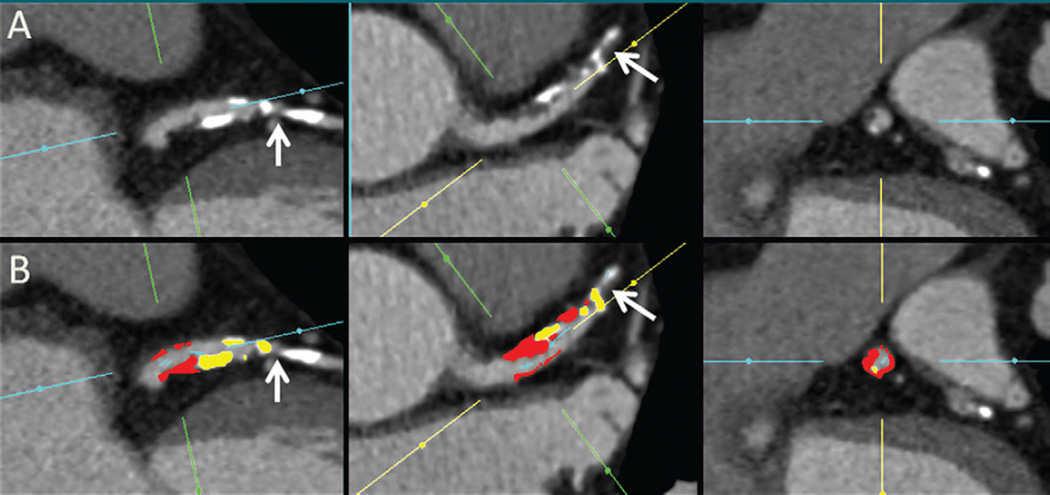
Figure 1.
Automated plaque quantification in a 65-year-old man. A, Long- and transverse-axis and, B, subsequent fully automated quantification CT angiograms obtained after manual setting of proximal and distal limits of the lesion show noncalcified (red areas), calcified (yellow areas), and low-attenuation (orange areas) plaque and the location where FFR (0.78) was performed (arrows). Despite the presence of a low-diameter stenosis (34%) and a high total (43.2%) and noncalcified (30%) plaque burden, ischemia was correctly predicted with FFR.

