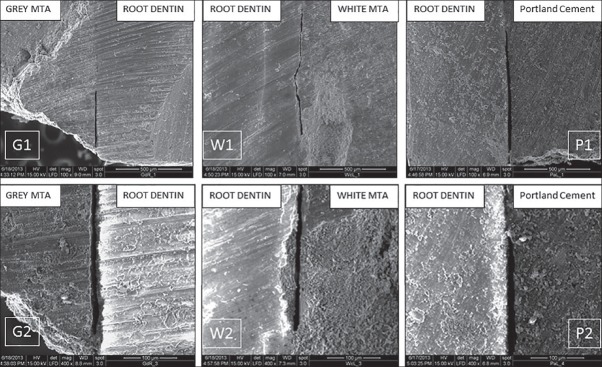
Figure 1.

Scanning electron microscopy pictures of G1 and G2 (Group G specimen showing gap at ×100 and ×400 respectively), W1 and W2 (Group W specimen showing gap at ×100 and ×400 respectively) and P1 and P2 (Group P specimen showing gap at ×100 and ×400 respectively)
