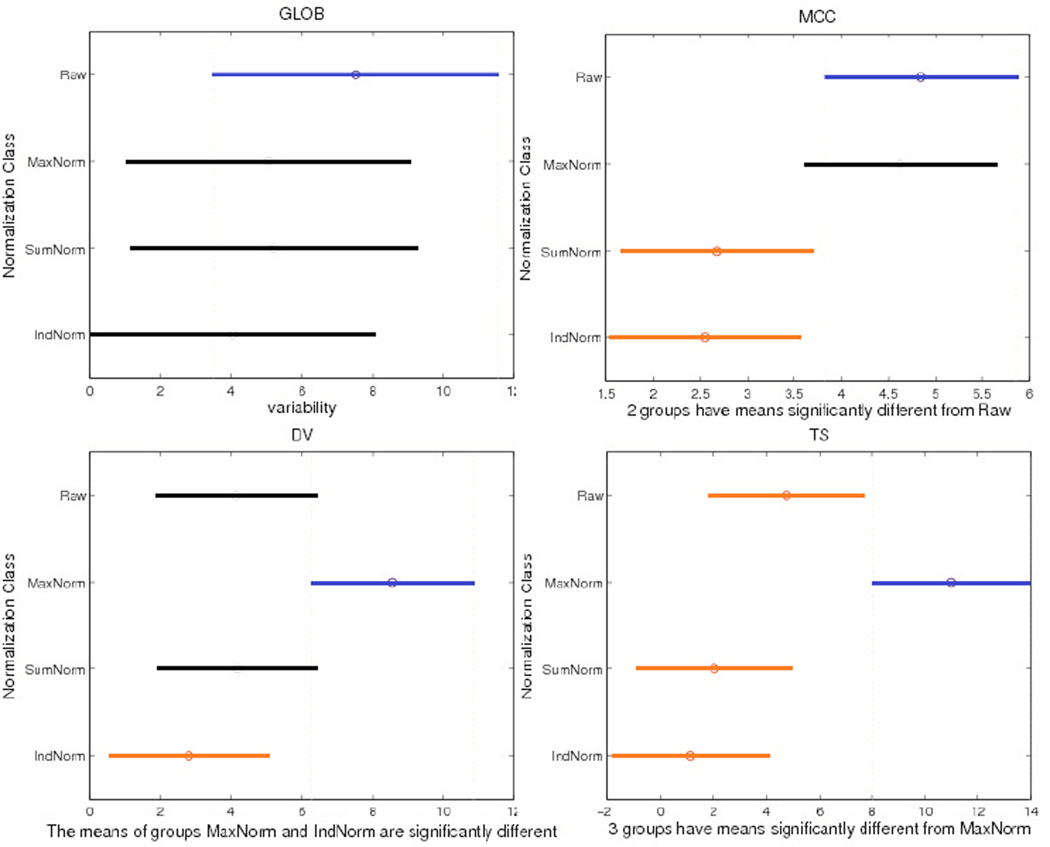
Figure 1.
One-Way ANOVA results for network measures. The y-axis shows the type of normalization used, and the x-axis is variability (Q) and its 95% confidence interval (CI) across the cohort described in Section 2.6. No CI overlap suggests significant differences between normalization methods. Different colors (blue and red) show pairs of methods with significant differences. We show GLOB as one example where there was no detectable difference in mean variability across the four normalization methods. For the network metrics MCC, DV and TS, there are significant differences among the four normalization methods - with P=2.5×10⁻³, 7.69×10⁻³ and 5.82×10⁻⁵ respectively in a one-way ANOVA.

