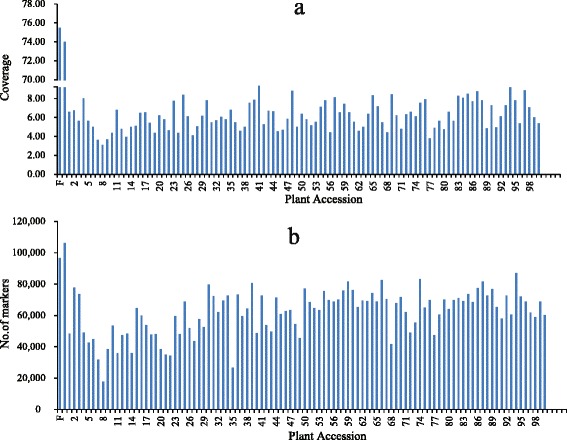
Fig. 1.

Coverage and number of markers for each double haploid (DH) individual and their parents. The x-axes in (a and b) indicate the plant accession, including the female parent and the male parent, followed by each of the DH individuals; the y-axes indicate coverage in (a) and number of markers in (b)
