
Fig. 4.
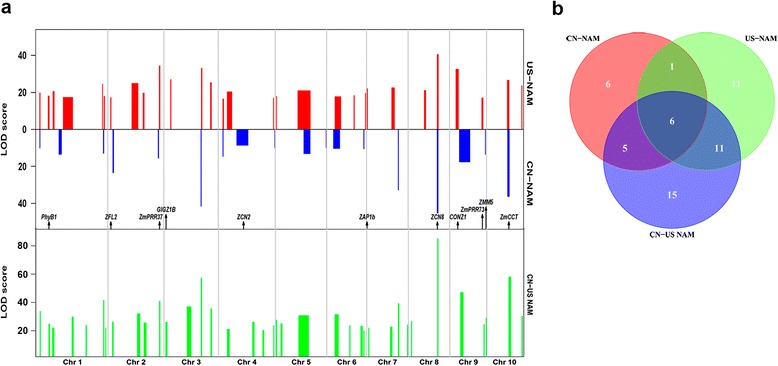
Comparison of QTL mapping results for days to tasseling (DT) among the US-NAM, CN-NAM, and CN-US NAM populations. a QTL mapping results for DT. The physical distance for each chromosome is represented in Mb (Mega-base) units on the horizontal axis. Bar width represents QTL confidence interval. Arrows represent the physical positions of the known maize flowering-time genes overlapping with QTL. b Venn diagram showing numbers of unique and shared QTLs among US-NAM, CN-NAM, and CN-US NAM