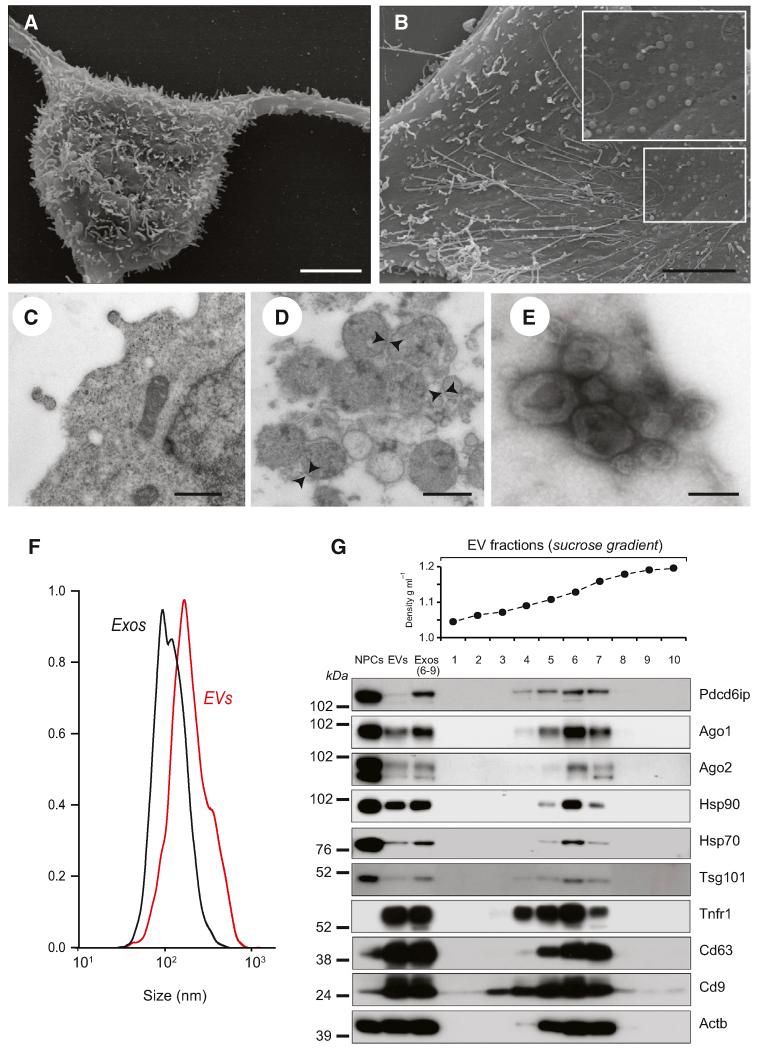
Figure 1. NPCs Secrete EVs.
(A) Scanning electron microscopy (SEM) of a NPC with long adherent expansions, and numerous membrane protrusions on the surface. Scale bars, 5 μm.
(B) SEM of the NPC surface, where membranous nanotubes and circular membrane vesicles are observed (magnified in the inset). Scale bars, 5 μm.
(C) Magnified TEM detail of a NPC secreting two small-sized vesicles. Scale bars, 500 nm.
(D) TEM of NPC EVs. EVs appear as heterogeneous population of differently sized vesicles (range 40–200 nm in diameter) surrounded by a double-layer membrane (arrowheads). Scale bars, 500 nm.
(E) TEM of negative stained EVs, showing cup-shaped vesicles (80–120 nm). Scale bars, 100 nm.
(F) Particle-size distribution of EVs (red line) and Exos (black line) obtained by NTA. Data are represented as mean ± SEM from n = 5 independent replicates and are normalized to 1 for size comparison.
(G) Western blot of exosomal markers in NPCs, EVs, and Exos. Exos correspond to pooled fractions 6–9, having a density between 1.13 and 1.20 g/ml. This panel is representative of n = 3 independent protein preparations showing the same trends.
See also Figure S1.

