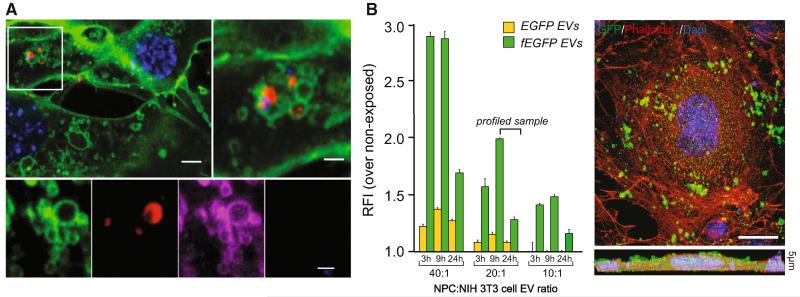
Figure 3. EVs Rapidly Adhere to and Are Incorporated into Target Cells via Plasma Membrane.
(A) CD63-RFP EV uptake in fEGFP target cells (in green) as early as 2 hr after transfer. EVs are in red under confocal and magenta under super-resolution STED microscopy. Scale bars: top left, 5 μm; top right, 2 μm; bottom, 1 μm.
(B) FCM analysis of EGFP internalization by target cells treated with increasing quantities of EVs. Data are represented as mean relative fluorescence intensity ± SEM from n = 3 independent experiments. A representative confocal image of a NIH 3T3 cell (red) exposed to fEGFP EVs (green) is shown. The lower panel is a Z stack of n = 5 optical slices taken at 1 μm intervals. Scale bar, 10 μm.
Nuclei in (A) and (B) were stained with DAPI (blue). See also Movie S1.

