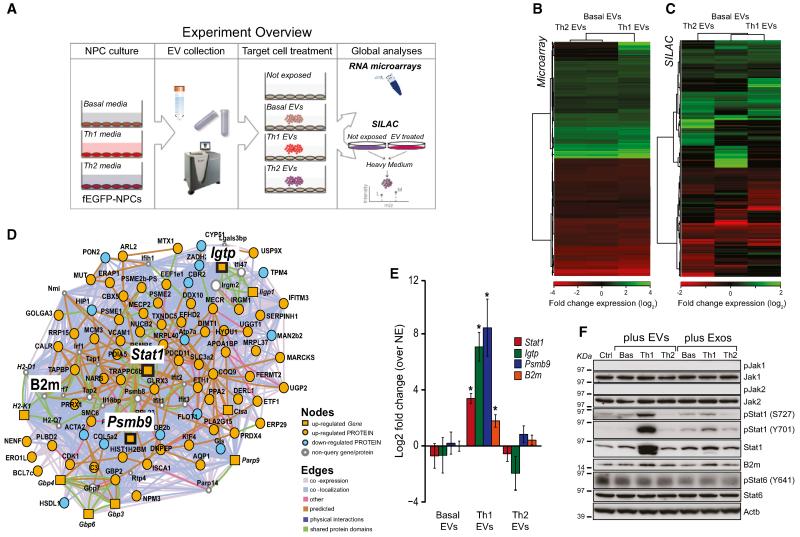
Figure 4. Th1 EVs Activate Signal Transduction along the Stat1 Pathway in Target Cells at Gene and Protein Levels.
(A) Experiment overview of whole transcriptome and proteome analyses in target cells exposed to NPC EVs.
(B) Heatmap of the relative fold changes of genes in target cells exposed to 20:1 NPC:NIH 3T3 ratios of basal, Th1, or Th2 EVs for 24 hr in vitro.
(C) Heatmap of the relative fold changes of proteins in target cells treated as in (B).
(D) Integrated GeneMANIA network of differentially expressed Th1-specific genes and proteins identified using microarray and SILAC, respectively, by comparing target cells exposed to Th1 EVs versus basal EVs.
(E) qPCR analysis of Stat1, Igtp, Psmb9, and B2M expression in target cells treated as in (B). Data are represented as mean log2 fold change ± SEM over target cells not exposed (NE) to EVs from a total of n = 3 independent experiments. *p < 0.05, compared to NE.
(F) Western blot of the Jak/Stat pathway in target cells treated as in (B). This panel is representative of n = 4 independent protein preparations showing the same trends. β-actin (Actb) was used as a loading control.
See also Table S3.

