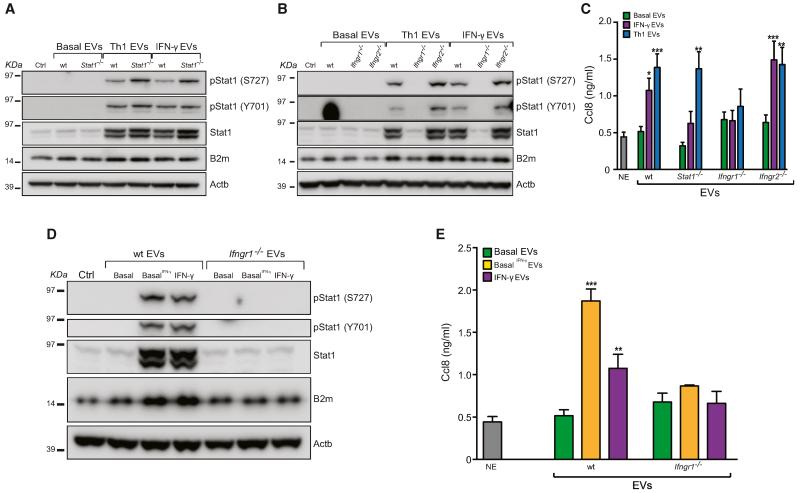
Figure 5. The IFN-γ/Ifngr1 Complex via EVs Activates Signal Transduction along the Stat1 Pathway in Target Cells.
(A and B) Western blot of the Stat1 pathway in target cells treated with WT, Stat1−/− (A) and Ifngr1−/− and Ifngr2−/− (B) EVs as in Figure 4F. These panels are representative of n = 3 independent protein preparations showing the same trends.
(C) Ccl8 release by target cells exposed to EVs as in (A) and (B), as measured by ELISA.
(D) Western blot of the Stat1 pathway in target cells exposed to basal EVs pretreated with 100 ng/ml IFN-γ (basal IFN-γ; same concentration used for NPCs). This panel is representative of n = 3 independent protein preparations showing the same trends.
(E) Ccl8 release by target cells exposed to EVs as in (D), as measured by ELISA.
Data in (C) and (E) are represented as mean ± SEM from a total of n ≤ 3 independent experiments. *p ≤ 0.01, **p ≤ 0.001, ***p ≤ 0.0001, compared to NE target cells not exposed (NE) to EVs. β-actin (Actb) was used as a loading control in (A), (B), and (D). See also Figures S5 and S6.

