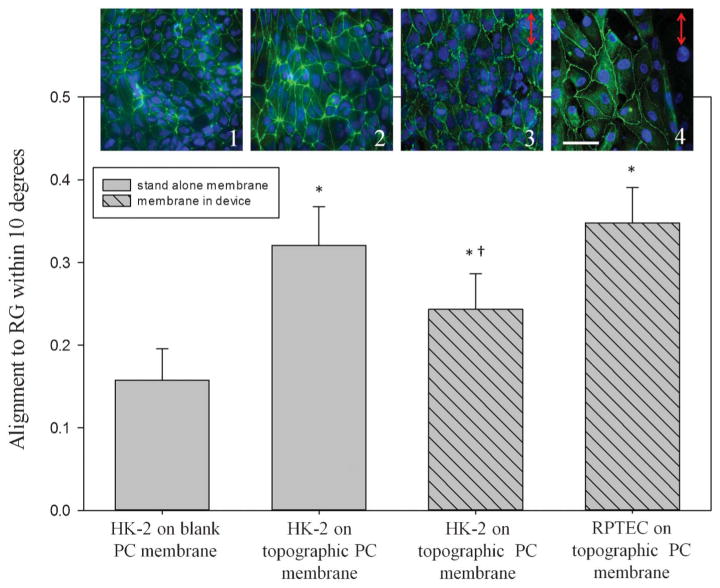
Fig. 6.
Renal epithelial cell nuclear alignment was quantified on topographically-patterned membranes outside the device and on membranes integrated in the device. HK-2 cells showed random alignment when cultured on non-patterned (1) PC membranes outside of the device. Alignment increased to 32% within 10° of the gratings on topographically-patterned membranes (2). Membranes assembled into the device also elicited alignment of cells to the gratings, with 25% of HK-2s (3) and 34% of RPTECs (4) aligning to the gratings. *, p < 0.05 compared to control samples, †, p < 0.05 compared to RPTECs. The images (top row) correspond to each bar of the graph; cell nuclei are labelled blue and tight junctions green. Scale bar: 50 μm. Arrows represent the direction of groove topography.

