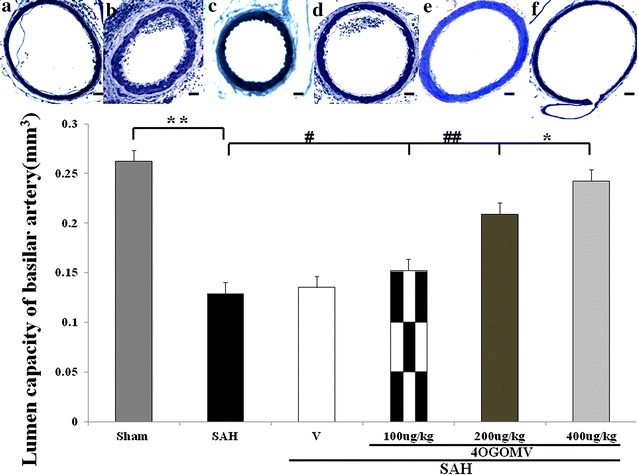
Fig. 1.

Comparison of lumen cross-sectional capacities of the basilar artery (bottom panel). Top panel represents micrographs of the BAs obtained from the healthy controls (a), the SAH-only rats (b), the vehicle-treated SAH rats (c), SAH rats receiving 100 μg/kg/day 4OGOMV treatment (d), SAH rats receiving 200 μg/kg/day (e), and 400 μg/kg/day 4OGOMV treatment (f). Standard bar = 200 μm. **P < 0.01: compared with the SAH and sham-operated group. #P > 0.01: comparison between the SAH group and the controls. #, ##P > 0.01, *P < 0.01: 4OGOMV + SAH groups compared with the SAH group. Data are mean ± SD (n = 9/group)
