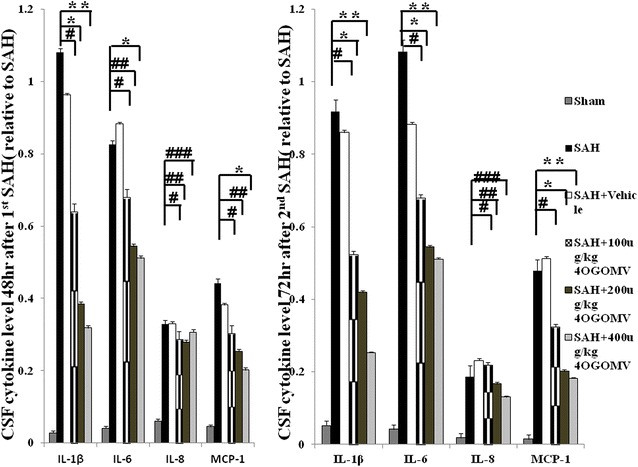
Fig. 3.

Bar graph depicting 4OGOMV on the time-course change of pro-inflammatory cytokines after the induction of double shot SAH. Data are depicted for IL-1β, IL-6, IL-8, MCP-1 at 48 h after 1st SAH and 72 h post 2nd SAH. Data in the figure are presented as mean ± SD (n = 9). *, **P < 0.01, and #, ##, ###P > 0.01 when compared with the SAH group
