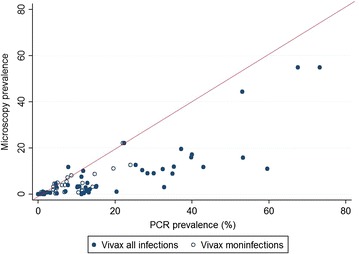
Fig. 2.

PCR P. vivax prevalence versus microscopy P. vivax prevalence, monoinfections and mixed infections. Scatter plot of the prevalence of P. vivax infection as determined by PCR versus prevalence of P. vivax as detected by microscopy. Prevalence pairs including only monoinfections (infections with only P. vivax) are shown in open circles and the prevalence pairs including all infections (P. vivax monoinfections and P. vivax infections where another species is also detected) are shown in filled circles. The line shows the expected association if both techniques were equally sensitive
