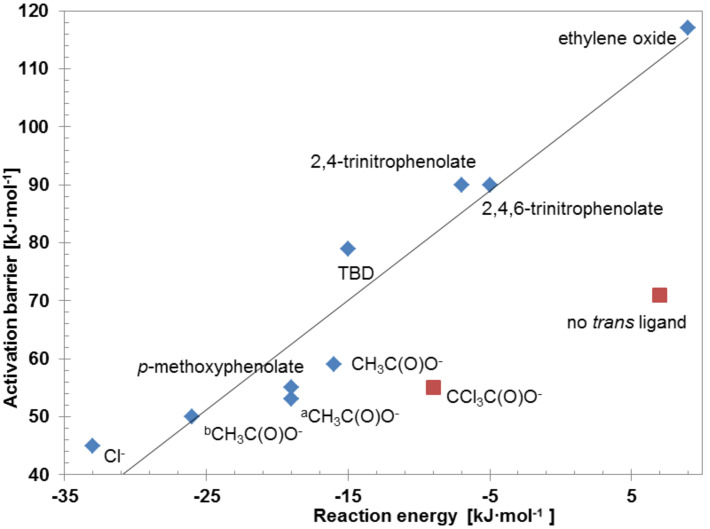
Figure 5.
Energy relationship between the activation barrier and the reaction energy of the CO2 incorporation reaction. Plotted are the results for different nucleophiles L, attached to the CoIII–salen base structure as depicted in Figure 2; asalen ligand 1a:  = -C4H8-, R3–6 = H; bsalen ligand 1b:
  = -C4H8-, R3–6 = t-Bu. The energies calculated for those ligands depicted with a red square do not follow the BEP relationship (for details, see text). The line represents the equation Ea = (1.9 ± 0.2)·ΔE + (99 ± 4) [kJ·mol−1].

