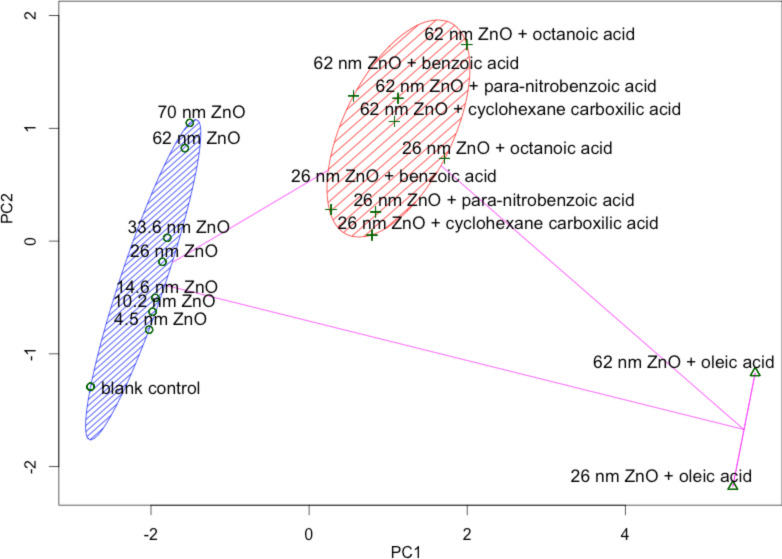
Figure 5.
Clustering analysis based on Euclidian distance for ZnO NPs partitioned into 3 clusters. Shown on the left (blue hash marks) are the bare ZnO NPs with the blank control point. In the middle (tan hash marks) are ZnO NPs with 4 different surface chemistries and on the right are the oleic acid modified particles.

