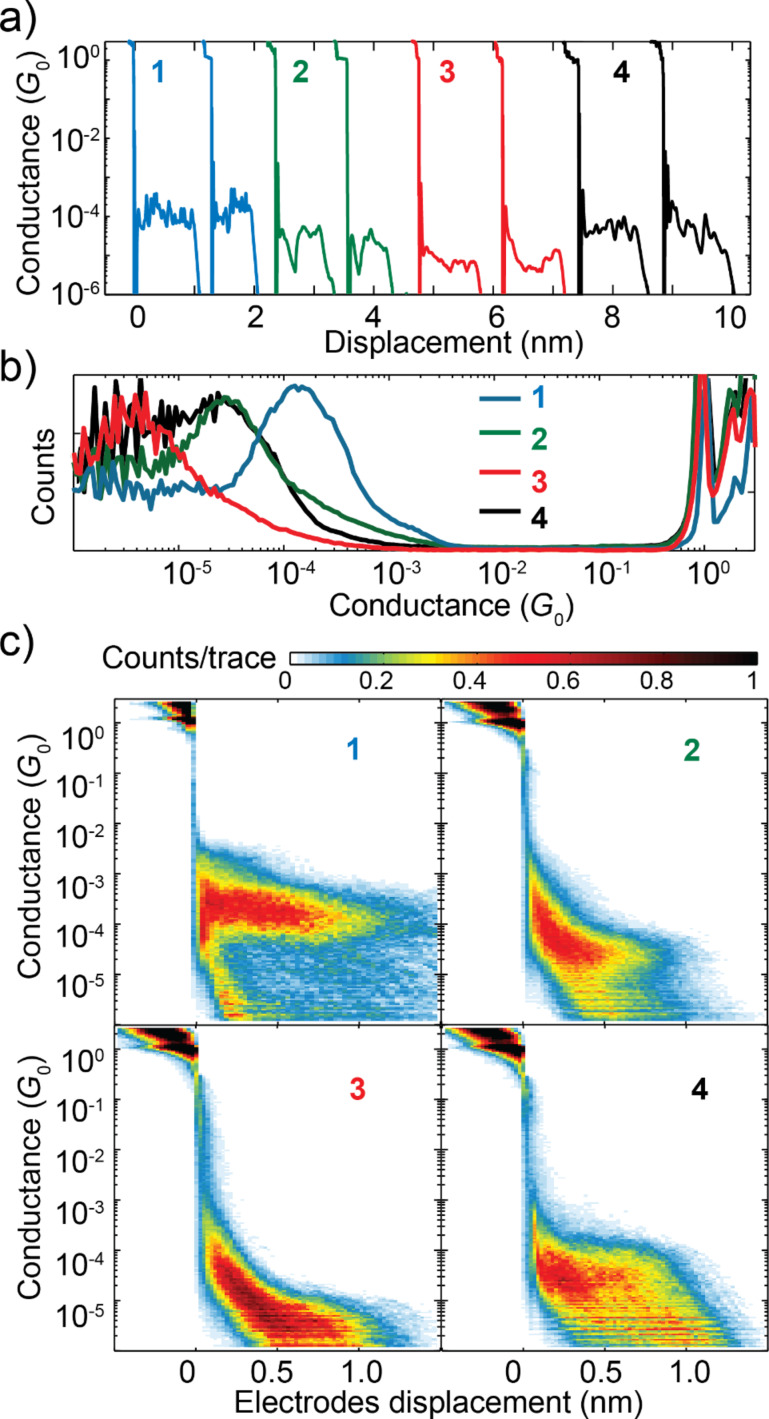
Figure 3.
(a) Individual breaking traces in presence of the molecules 1–4. The applied bias is 0.1 V and the electrode retraction speed is 5 nm/s. The traces are offset along the x-axis for clarity. (b) Conductance histograms built from more than 2000 breaking traces recorded in presence of the molecules 1–4. The breaking traces have been logarithmically binned, in the conductance axis, with 30 bins/decade. (c) Conductance–distance histograms built from the breaking traces of molecules 1–4. The displacement axis has been binned with 45 bins/nm.

