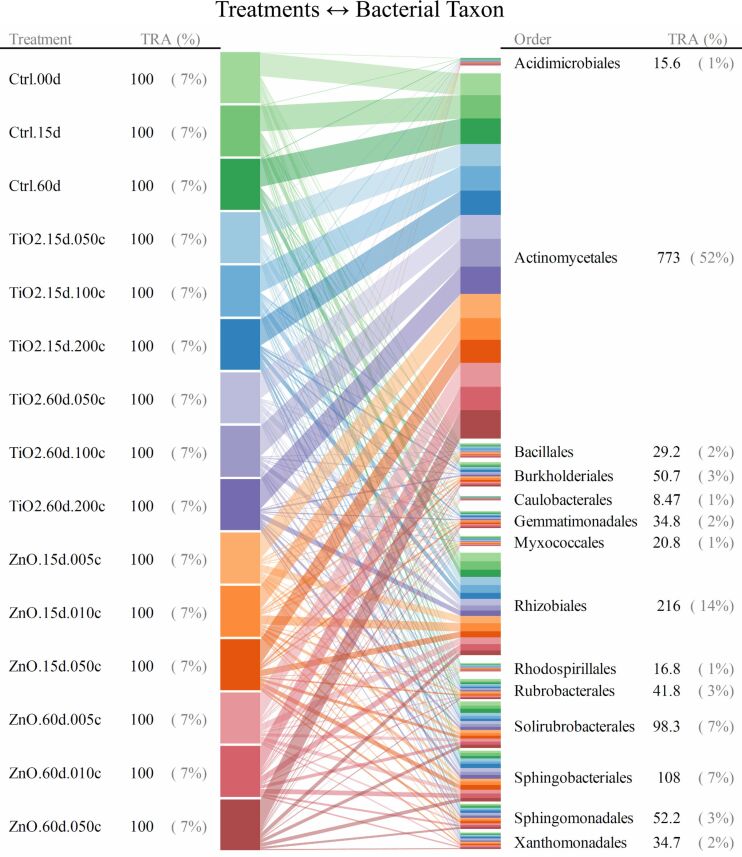
Figure 2.
Bipartite graph for MNP-bacteria interrelationships at order level. Soil bacteria taxa identified for the above graph are for the 95th–5th percentile range ≥ 10/n (n denotes the total number of bacterial taxa at a given taxonomic level) in relative abundance. TRA denotes total relative abundance. The treatments are labelled as “--.##d.##c”, where “--” identifies the treatment type (i.e., TiO2 MNP, ZnO MNP, or control), “##d” denotes exposure time of ## day, and “##c” represents exposure dose of ##×10−2 mg/g (soil).

