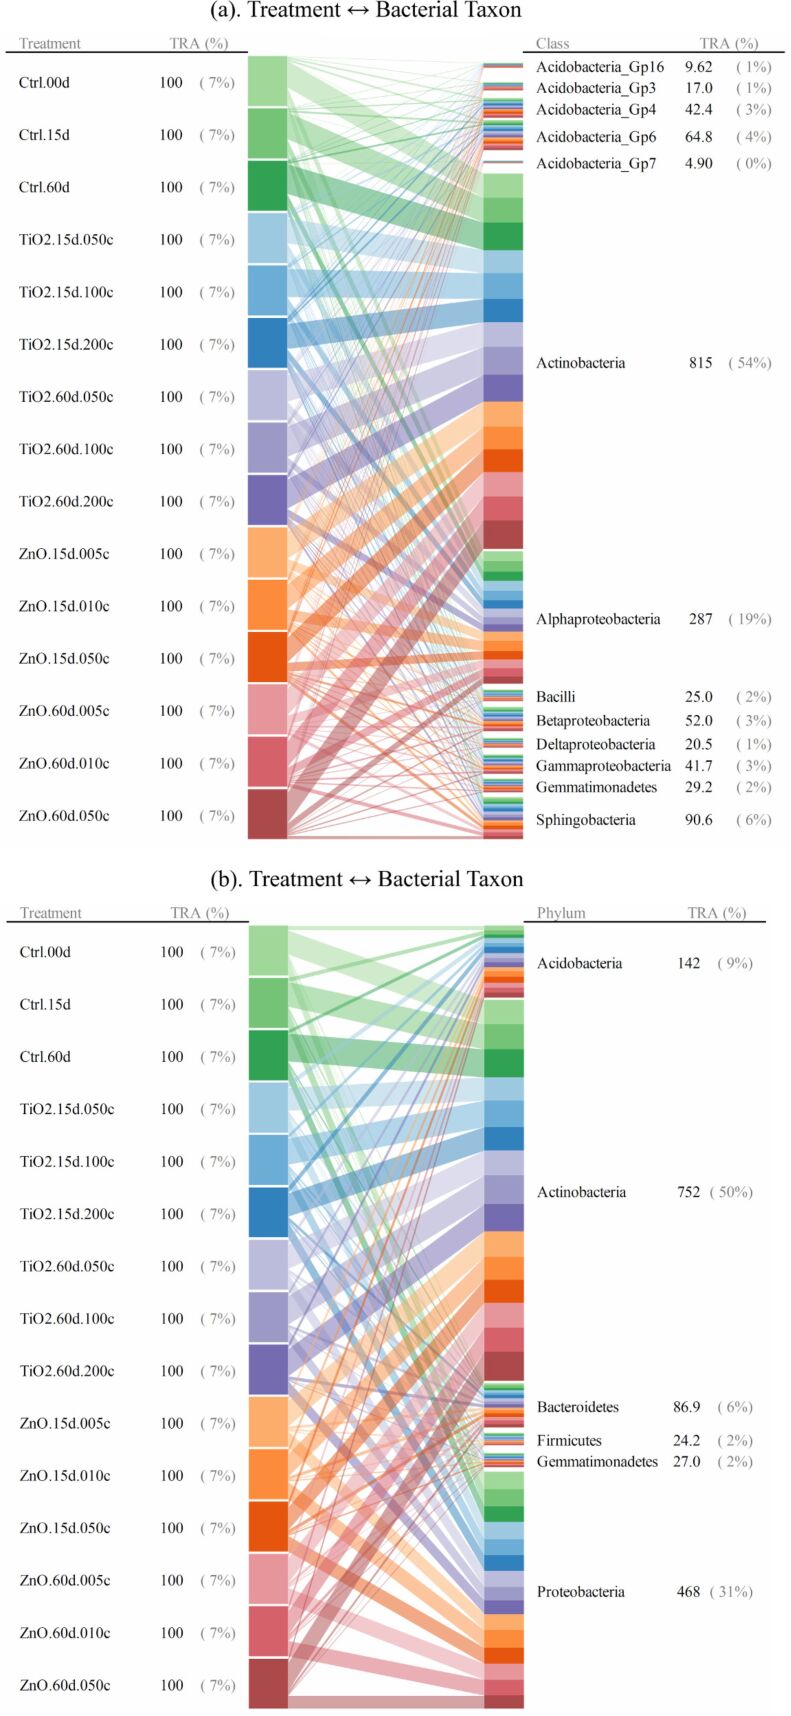
Figure 7.
Bipartite graphs for MNP-bacteria interrelationships at (a). class, and (b). phylum levels. Soil bacteria taxa identified for the above graph are for the 95th–5th percentile range ≥ 10/n (n denotes the total number of bacterial taxa at a given taxonomic level) in relative abundance. TRA denotes total relative abundance. The treatments are labelled as in Figure 2.

